
A Comparative Study of Snyder and Clark Hydrological Procedures for Flood Peaks Estimation
Downloads
Contents
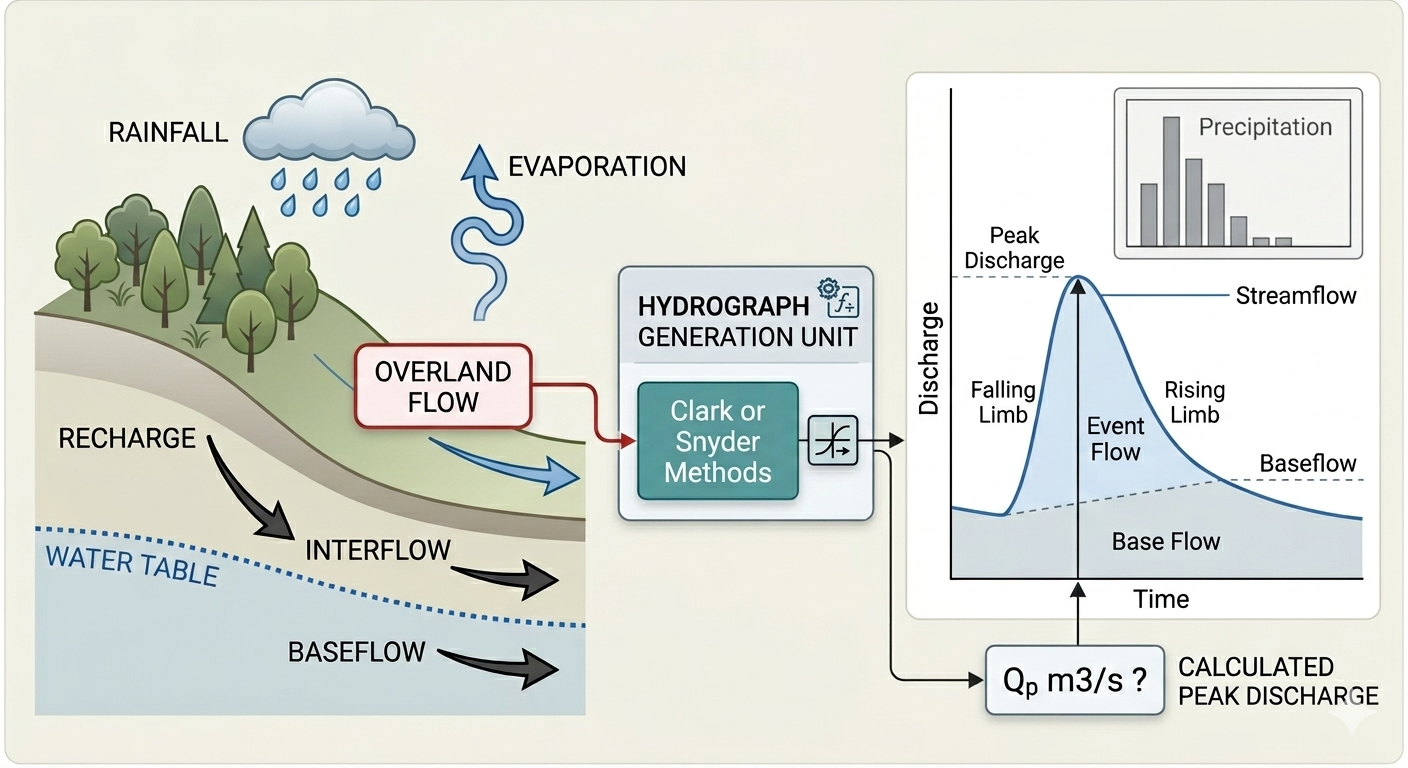
Abstract
The Snyder (HP11) and Clark (HP27) hydrological procedures are valuable tools in managing water resources in urban and rural areas across Malaysia. This study presents an extensive comparative assessment of these two procedures in estimating different watersheds flood peak flows. A total of 22 watersheds on Langkawi Island were simulated, representing a range of catchment types and characteristics, with catchment areas ranging from 1 to 68.2 km², and slopes between 1.54% to 24.77%, encompassing small to moderately large basins with gentle to steep terrain. For HP11 analysis, a Microsoft Excel spreadsheet was developed and used to perform the analysis based on triangular distribution of direct runoff following Snyder’s method. On the other hand, HEC-HMS software was used to perform hydrological analysis based on HP27 guidelines for both current and future land-use scenarios following Clark Unit Hydrograph Method. Obtained results were analyzed statistically using SPSS covering several parameters and tests. The results showed that the estimated design peak flows using HP11 procedure were higher compared with those estimated using HP27 for same land-use condition especially at higher ARIs. The percentage difference reached more than 70% depends on catchment characteristics. The estimated design peak discharge flows for future land use distribution were increased as expected due to the increment in the imperviousness of the catchment area, which contributes to higher peak discharge values as the critical storm duration shifts to a shorter period. Overall, the study demonstrates that the choice of hydrological procedure has a significant impact on flood estimation and should be carefully considered in future planning and design.
Introduction
Flooding events can cause widespread damage to infrastructure (Hussain Shah et al., 2023), agriculture, and ecosystems, and pose significant risks to human life and property (Al-Qadami et al., 2024; Shah et al., 2020) . Island ecosystems like Langkawi face unique challenges in water resource management due to their inherent vulnerabilities, which are further exacerbated by the increasing frequency and intensity of floods. Moreover, the limited freshwater resources, coupled with increasing population and tourist activity, necessitate a data-driven approach to ensure sustainable water supplies (Elfithri et al., 2021; Förster et al., 2019) . Thus, hydrological analysis plays a critical role in this regard, providing insights into the water flow characteristics of river basins, which are essential for various applications like flood risk mitigation, water supply planning, and hydropower generation (Rafique et al., 2020).
The selection of appropriate hydrological procedures is crucial for obtaining reliable results. For various hydrological applications, including streamflow estimation, flood forecasting, and water resource assessment, hydrological procedure No. 11 (HP11) and hydrological procedure No. 27 (HP27) are widely used methodologies in Malaysia (Ata et al., 2023b; Jumaat et al., 2018; Khor et al., 2023) . However, their effectiveness can vary depending on the factors like geographical setting, data availability, and catchment characteristics (Iresh et al., 2024). It is evident that HP11 has been applied in diverse geographical contexts (Zanial et al., 2023), however its application to Langkawi Island ecosystems is limited where existing research on its hydrology often focuses on specific aspects like climate change impacts or water quality assessments. The HP27 procedure incorporated in HEC-HMS and HEC-RAS has been also employed at various studies to analyze flood risks, forecast rainfall-runoff processes, and develop effective water management strategies at different river basin across Malaysia (Ata et al., 2023a; Ismail et al., 2020; Jabbar et al., 2021; Mohammed et al., 2021; Ramly & Tahir, 2016) . Worldwide, these techniques, Snyder’s (HP11) and Clark’s (HP27) unit hydrograph methods have been extensively applied to simulate watershed response and estimate peak discharge for planning and engineering purposes. Synthetic approaches enable conversion of rainfall inputs into flood hydrographs without the need for extensive observed data, making them especially valuable for ungauged or data-scarce basins (Wałęga et al., 2011).
The department of irrigation and drainage Malaysia (DID) has published 32 hydrological procedures since 1973 to be used as guidelines for both government and private sectors in developing hydrological monitoring programmes (Hassan & Ghazali, 2019). These procedures have been continuously updated and refined as more advanced tools, and longer historical datasets have become available. In general, the developed 32 hydrological procedures can be classified into three main categories, namely (i) hydrological design procedures, which include various methods and analytical approaches (HP1, HP4, HP5, HP11, HP12, HP13, HP16, HP17, HP18, HP20, HP26, and HP27), (ii) data-related procedures, covering hydrological data collection, management, and quality control techniques (HP2, HP6, HP7, HP10, HP15, HP19, HP22, and HP28), and (iii) instrumentation procedures, which specify standards and guidelines for hydrometric instruments (HP3, HP8, HP9, HP14, HP21, HP23, HP24, HP25, HP32, HP33, HP34, and HP35). These procedures offer reliable and realistic estimates of design surface runoff and flood hydrographs, enabling the determination of appropriate structure sizes for effective drainage and other control measures in line with the required protection level (Hassan & Ghazali, 2019). Although these procedures are generally reliable, the accuracy of their output largely depends on the quality of the data collected, making it essential for hydrologists to apply best practices during data collection and analysis.
The HP11 (Snyder-based synthetic unit hydrograph) and HP27 (Clark Unit Hydrograph in HEC-HMS), as recommended in the Malaysian Urban Stormwater Management Manual (MSMA), are widely used for flood estimation. Previous studies have generally applied these methods independently rather than conducting systematic multi-catchment comparisons or evaluating their sensitivity to land-use change. As a result, uncertainties remain regarding differences in peak discharge estimations under varying physiographic and development conditions. Therefore, this study contributes to the field of hydrological modeling and flood risk management by providing a comparative analysis of two hydrological procedures, HP11 and HP27, for the Langkawi Island river basins. Unlike previous studies that focused primarily on single hydrological models, this paper aims to offer a direct comparison of the performance and applicability of these two procedures in estimating peak discharge flows. Furthermore, this work highlights the impact of future land use changes on peak discharge values, thus aiding long-term planning and disaster mitigation strategies. Thus, it is believed that it sets the stage for future research to improve the reliability of hydrological simulations through enhanced data collection and model validation techniques.
Methodology
Study Area
This paper presents a comparative hydrological analysis for Langkawi Island River basins based on Hydrological Procedure 11 and 27 proposed by the Department of Irrigation and Drainage, Malaysia. Geographically, Langkawi Island is located in the Andaman Sea, situated approximately 30 kilometers off the northwest coast of Peninsular Malaysia as shown in Figure 1.
Figure 1. River catchments of Langkawi Island.
It is part of the state of Kedah and is the largest island in the Langkawi archipelago, which comprises a cluster of 99 islands. The island’s interior is dominated by rugged mountains and dense tropical vegetation, providing a habitat for a diverse array of flora and fauna. Langkawi Island’s surface model reflects its varied terrain, which ranges from low-lying coastal areas to steep, mountainous peaks. The island’s highest point is Gunung Raya, standing at approximately 881 meters above sea level. The island contains 22 river basins where Melaka River catchment area is largest with an average area of 68.2 km2 as shown in Figure 1, while the characteristics of all 22 basins are summarized in Table 1.
|
ID |
River name |
A (km2) |
L (km) |
S (%) |
ID |
River name |
A (km2) |
L (km) |
S (%) |
|
L1 |
S. Melaka |
68.2 |
14.2 |
9.27 |
L12 |
S. Ayer Hangat |
11.1 |
7.59 |
7.02 |
|
L2 |
S. Ranggot Besar |
5.6 |
3.28 |
1.54 |
L13 |
S. Kilim |
19.4 |
6.91 |
16.15 |
|
L3 |
S. Belikit |
1.0 |
1.72 |
15.2 |
L14 |
S. Kisap |
39.9 |
14.3 |
14.64 |
|
L4 |
S. Perangin |
8.8 |
5 |
20.06 |
L15 |
S. Tk Apau |
3.0 |
2.26 |
15.52 |
|
L5 |
S. Tama Besar |
3.1 |
3.38 |
24.77 |
L16 |
S. Kuah |
14.0 |
6.26 |
13.65 |
|
L6 |
S. Tama Kechil |
3.1 |
3.37 |
23.59 |
L17 |
S. Kelibang |
3.3 |
3.82 |
12.8 |
|
L7 |
S. Datai |
2.6 |
2.48 |
21.4 |
L18 |
S. Batu Asah |
11.6 |
6.49 |
13.91 |
|
L8 |
S. Kubang Badak |
37.4 |
10 |
12.58 |
L19 |
S. Pengkalan Tempa |
3.8 |
3.28 |
6.97 |
|
L9 |
S. U |
3.8 |
2.94 |
12.31 |
L20 |
S. Langkanah |
5.5 |
3.1 |
10.46 |
|
L10 |
S. Tok Puteri |
20.2 |
9.37 |
13.75 |
L21 |
S. Chenang |
14.9 |
4.95 |
6.02 |
|
L11 |
S. Padang Lalang |
4.5 |
4.19 |
4.35 |
L22 |
S. Temoyong |
3.9 |
4.34 |
11.84 |
Analysis Procedure
DID Hydrological Procedure No. 11 (HP11) and Hydrological Procedure No. 27 (HP27) were adopted to estimate the design peak discharge of river catchments. The input parameters of the models were derived from the topographical data and satellite images as well as previous study reports. Firstly, the Intensity-Duration-Frequency (IDF) Curves was derived from Hydrological Procedure No. 1 (HP 1) for two nearest stations to the study area namely Setor JPS Alor Setar (ID 6103047) and Station Kedah Peak (ID 5704055), while the rainfall temporal pattern used for the analysis of this study was adopted from HP1, 2015 version.
HP 11 Analysis Procedure
Hydrological Procedure No. 11 (HP11) is a widely used procedure for estimating design flood hydrographs in rural catchments of Peninsular Malaysia, first introduced by DID in 1980. The method incorporates various catchment characteristics and accounts for storms with different temporal patterns, recommending the use of a synthetic unit hydrograph based on Snyder’s method. For this study, a spreadsheet calculator was developed in accordance with HP11 guidelines and calibrated using the example provided in the manual to derive the flood hydrographs for all river basins.
The general formula that can be used to calculate the peak discharge is described below (Eq. (1)). The descriptor that shaping the Snyder’s unit hydrograph is the peaking coefficient (Cp) which is ranging between 0.34 to 0.74 for Peninsular Malaysia. Since Cp is not strongly related to any catchment characteristics, therefore, the average value of 0.55 was used in this study.
Where, Qp is the peak discharge, Cp is the peaking coefficient, U is the unit depth of net rainfall (0.275 for 1 mm standard UH), and Lg is the lag time. To calculate the lag time (Lg), three main inputs are needed including catchments area, mean stream length, and stream slope which are listed in Table 1. Basically, lag time is the delay between the rainfall event peak and resulting hydrograph peak at specific downstream point. According to HP11 procedure, the best fit of Lg for Peninsular of Malaysia is shown in Eq. (2).
Where, Lg is the lag time in hr, A is the catchment area in km2, L is the main stream length from catchment boundary to catchment outlet in km, S is the weighted slope of main stream in %.
HP27 Analysis Procedure
Hydrological Procedure No. 27 (HP27) hydrological procedure adopts Clark’s method to generate unit hydrograph by combining time-area curve i.e., how long water from each sub-area takes to reach the outlet, and simple linear reservoir i.e., attenuation, that represents storage and smoothing in the basin channel (Ahmad et al., 2009; Rajkumar et al., 2019) .
The assumption of this method is that the translation of flow could be described by the time area curve, which indicates the fraction of catchment area contributing runoff to the catchment outlet as a fraction of time since the start of effective rainfall. The time-area curve (see Eqs. (3) and (4)) is defined within the limits of the time of concentration (Tc), which serves as one of the key parameters in the Clark Unit Hydrograph method. On the other hand, the attenuation process is represented by a simple linear reservoir related to the outflow (see Eq. (5)).
where At is the cumulative catchment area contributing at time t, A is the total catchment area, Tc is the time of concentration of the catchment, S is the catchment storage, R is the catchment storage coefficient, and O is the outflow amount from the catchment.
To calculate the time of concentration (Tc) and storage coefficient (R) of the catchments in Peninsular of Malaysia, HP27 procedure proposed Eq. (6) and (7) respectively. These two parameters mainly depend on catchment characteristics including area (A) in km2, stream slop (S) in m/km, and stream length (L) in km.
To estimate the flood hydrograph for the 21 catchments at the study area, HEC-HMS software was used for simulation purposes. The simulation was performed for both present (PLS) and future (FLS) land-use (2030) taking into account the effects of the expected development on the flood hydrographs for each river basin. In general, there are two main factors of urbanization that can increase the peak discharges, namely (i) increase the runoff volume due to increase in the impervious areas, and (ii) reduction in time of concentration of the catchment due to channelization of drainage routes, which can shift the critical storm to much shorter rainfall duration with higher intensity. The increase of impervious areas in a specific catchment can be keyed-in into the HEC-HMS directly by specifying the total percentage of impervious areas for current and future land-use scenarios. In terms of reduction of time of concentration, a proposed method by USGS -Water-Resources Investigation Report 00-4184 was recommended to calculate a reduction factor for Tc based on the percentage of imperviousness. Also, the increment of impervious areas has effects on the storage coefficient, the reduction factor for this parameter was also adopted from the same report reported by USGS. Figures 2a and 2b shows the reduction factor for both Tc and R, respectively. After obtaining all the required parameters, HP27 model was run in HEC-HMS as mentioned earlier and the input values for each catchment are presented in the attached appendix “A”.
Results
IDF Curves Analysis
The Intensity-Duration-Frequency curve (IDF) is basically a graphical tool commonly used in hydrology to show the relationship between rainfall intensity, its duration, and its frequency of occurrence. To have an overview of the likelihood of extreme rainfall at different return periods at the study area, IDF curves were calculated at two hydrological stations near the study area as mentioned in Section 2.2. Tables 2 and 3 details the rainfall intensity (IDF curves values) at Setor JPS Alor Setar (ID 6103047) and Kedah Peak (ID 5704055) stations, respectively.
Figure 2. Relationship between imperviousness percentage and time of concentration (left) storage coefficient (right), Source USGS Water-Resources Investigation Report 00-4184.
The comparative analysis of the IDF curves for the Alor Setar (Station ID 6103047) and Kedah Peak (Station ID 5704055) stations demonstrates notable spatial and temporal variations in rainfall intensity across different durations and return periods. As expected, the rainfall intensity increases consistently with longer return periods for both stations, reflecting the higher likelihood of extreme precipitation events over extended recurrence intervals. However, Kedah Peak generally exhibits higher rainfall intensities compared to Alor Setar, particularly at shorter storm durations. This difference can be attributed to orographic effects, as Kedah Peak is located in a more elevated terrain, which enhances convective activity and moisture accumulation, leading to more intense short-duration storms. Conversely, Alor Setar, being in a relatively lowland area, shows slightly lower intensities but with more gradual increments across storm durations.
|
Duration (hr) |
Average Recurrence Interval (ARI) | ||||||
|
2-yr |
5-yr |
10-yr |
20-yr |
25-yr |
50-yr |
100-yr | |
|
0.5 |
83.27 |
97.12 |
109.12 |
122.59 |
127.28 |
142.99 |
160.65 |
|
1 |
51.12 |
66.99 |
51.12 |
51.12 |
87.78 |
98.62 |
110.80 |
|
2 |
32.77 |
42.95 |
32.77 |
32.77 |
56.28 |
63.23 |
71.04 |
|
3 |
24.67 |
32.33 |
24.67 |
24.67 |
42.37 |
47.60 |
53.48 |
|
6 |
14.78 |
19.37 |
14.78 |
14.78 |
25.39 |
28.52 |
32.05 |
|
12 |
8.68 |
11.38 |
8.68 |
8.68 |
14.91 |
16.75 |
18.82 |
|
24 |
5.04 |
6.61 |
5.04 |
5.04 |
8.66 |
9.73 |
10.93 |
|
48 |
2.91 |
3.82 |
2.91 |
2.91 |
5.00 |
5.62 |
6.31 |
|
72 |
2.11 |
2.76 |
2.11 |
2.11 |
3.62 |
4.07 |
4.57 |
|
Duration (hr) |
Average Recurrence Interval (ARI) | ||||||
|
2-yr |
5-yr |
10-yr |
20-yr |
25-yr |
50-yr |
100-yr | |
|
0.5 |
98.20 |
117.95 |
135.49 |
155.63 |
162.74 |
186.94 |
214.73 |
|
1 |
72.21 |
86.73 |
99.62 |
114.44 |
119.66 |
137.46 |
157.89 |
|
2 |
49.39 |
59.32 |
68.14 |
78.28 |
81.85 |
94.02 |
108.00 |
|
3 |
38.57 |
46.33 |
53.22 |
61.13 |
63.92 |
73.43 |
84.35 |
|
6 |
24.57 |
29.51 |
33.89 |
38.94 |
40.71 |
46.77 |
53.72 |
|
12 |
15.30 |
18.38 |
21.11 |
24.25 |
25.36 |
29.13 |
33.46 |
|
24 |
9.41 |
11.31 |
12.99 |
14.92 |
15.60 |
17.92 |
20.59 |
|
48 |
5.76 |
6.91 |
7.94 |
9.12 |
9.54 |
10.96 |
12.59 |
|
72 |
4.31 |
5.18 |
5.95 |
6.83 |
7.14 |
8.20 |
9.42 |
From a hydrological and engineering perspective, these spatial disparities in IDF values carry important implications for flood risk assessment and stormwater management design in Kedah state. The higher short-duration intensities at Kedah Peak highlight the need for robust drainage infrastructure and flood mitigation strategies in upland areas, where flash flooding risks are amplified. Meanwhile, the relatively lower but sustained intensities in Alor Setar area toward cumulative flood hazards in downstream urban settings, where prolonged rainfall can overwhelm stormwater systems.
Statistical Analysis
Three statistical analysis was performed using SPSS software version 27 including (i) Spearman’s test to identify which physical catchment factors most strongly influence discharge differences, (ii) Wilcoxon nonparametric test to determine whether the differences between the simulated HP11 and HP27 peak flows are statistically significant or not, and (iii) Wilcoxon nonparametric test between simulated flows using HP 27 PLS and HP 27 FLS.
Table 4 shows the outputs of Spearman’s correlation test where three ARIs (2-yr, 25-yr, and 100-yr) only included beside catchment area, stream slope, and stream length. The catchment area and stream length showed very strong positive correlation with peak discharges across all methods and ARIs with p value of less than 0.001 which is expected as larger areas and longer streams consistently generate higher peak flows, regardless of hydrological procedure or land use scenario. On the other hand, stream slope and peak flow relationships noticed to be weak with p value greater than 0.05. The negative correlation between stream slope and peak flows can be attributed to the smaller catchment areas and shorter flow paths of steeper basins. For instance, the L5 basin has the highest stream slope but a relatively small area of only 3.38 km²; thus, although runoff moves faster, the total water volume is limited, resulting in lower peak discharges. Generally, negative correlation here means that when slope increases, peak flow tends to reduce, but the relationship is weak and not statistically significant (p > 0.05). This observation is also consistent with the structure of the HP27 empirical relationships, particularly Equation (7), in which the storage coefficient 𝑅 R is inversely related to stream slope through a negative exponent. This implies that steeper basins exhibit lower storage potential and faster hydrologic response, but not necessarily higher peak discharges when catchment area and stream length are limited. Furthermore, Equation (7) highlights that slope alone does not govern peak flow generation; rather, peak discharge is controlled by the combined effects of catchment area, stream length, and slope. This explains why steeper basins in the present study do not exhibit higher peak flows despite their greater slopes.
Table 5 and Figure 3 show the results of Wilcoxon nonparametric test performed on the simulated peak flows for both HP11 and HP27 PLS. Based on Figure 3 it can be noticed that for high return periods (ARI), HP11 method predicted higher peak flows, while only at 2-year ARI, the HP27 predictions found to be higher. The P-value of the Wilcoxon nonparametric test presented in Table 5 showed that there is a significant statistical difference between HP11 and HP27 hydrological procedures where p-values are mostly less than 0.05. The difference increases when ARI increases i.e., at high ARI the differences between HP11 and HP27 are high, and this difference decreases where ARI decreases. Thus, it is important to properly select the hydrological procedure when performing hydrology monitoring and analysis for higher ARIs, especially when the analysis is going to be used for infrastructure design and flood assessment.
|
Item |
Coefficient |
ARI | ||||||||
|
2yr-HP11 |
2yr-HP27 PLS |
2y-HP27 FLU |
25-yr HP11 |
25yr-HP27 PLS |
25yr-HP27 FLU |
100yr-HP11 |
100yr-HP27 PLS |
100yr-HP27 FLU | ||
|
Area (km2) |
Correlation Coefficient |
0.994 |
0.922 |
0.908 |
0.992 |
0.922 |
0.924 |
0.979 |
0.910 |
0.911 |
|
p-value |
0.000 |
0.000 |
0.000 |
0.000 |
0.000 |
0.000 |
0.000 |
0.000 |
0.000 | |
|
Length (km) |
Correlation Coefficient |
0.879 |
0.788 |
0.769 |
0.893 |
0.787 |
0.783 |
0.891 |
0.774 |
0.771 |
|
p-value |
0.000 |
0.000 |
0.000 |
0.000 |
0.000 |
0.000 |
0.000 |
0.000 |
0.000 | |
|
Slop (%) |
Correlation Coefficient |
-0.307 |
-0.096 |
-0.130 |
-0.289 |
-0.093 |
-0.145 |
-0.314 |
-0.073 |
-0.121 |
|
p-value |
0.164 |
0.670 |
0.564 |
0.192 |
0.681 |
0.518 |
0.155 |
0.747 |
0.591 | |
|
Coefficient |
2y-HP27 PLS : 2yr-HP11 |
5yr-HP27 PLS : 5yr-HP11 |
10yr-HP27 PLS : 10yr-HP11 |
20yr-HP27 PLS : 20yr-HP11 |
25yr-HP27 PLS : 25-yrHP11 |
50yr-HP27 PLS : 50yr-HP11 |
100yr-HP27 PLS : 100yr-HP11 |
|
Z |
-2.715b |
-1.221c |
-2.871c |
-3.362c |
-3.445c |
-3.996c |
-4.076c |
|
p-value |
0.007 |
0.222 |
0.004 |
0.001 |
0.001 |
0.000 |
0.000 |
b= based on negative ranks, c= based on positive ranks
Figure 3. Wilcoxon nonparametric test ranks, negative (HP27 < HP11), positive (HP27 > HP11), ties (HP27 = HP11).
Wilcoxon nonparametric test was also performed between HP 27 PLS and HP 27 FLS to identify whether the differences between the simulated peak flows are statistically significant or not. It was done to see the effects of the land-use changes on the peak flows for future scenarios. Table 6 and Figure 4 show the p-value and rank distribution, respectively. According to Figure 4, the peak flows for the future land-use (FLS) clearly noticed to be higher than the present land-use (PLS) condition, where the positive ranks (HP27 FLS > HP27 PLS) found to be the dominant among all the ARIs. This reflects the changes in land-use in the coming years where more impervious areas and developments are expected to be established. Based on table, the p-value found to be less than 0.05 which means that the differences between the simulated peak flows for present and future land-use scenarios are statistically significant.
Table 1. Details of the Langkawi Island rivers’ streams and catchments.
Table 2. Design rainfall intensity (mm/h) for various ARIs for JPS Alor Setar Station (ID 6103047).
Table 3. Design rainfall intensity (mm/h) for various ARIs for Kedah Peak Station (ID 5704055).
Table 4. Spearman’s correlation test results
Table 5. Wilcoxon nonparametric test results (HP 11 and HP 27 PLS)
Table 6. Wilcoxon nonparametric test results (HP 27 PLS and HP 27 FLU).
|
Coefficient |
2y-HP27 FLU - 2y-HP27 PLS |
5yr-HP27 FLU - 5yr-HP27 PLS |
10yr-HP27 FLU - 10yr-HP27 PLS |
20yr-HP27 FLU - 20yr-HP27 PLS |
25yr-HP27 FLU - 25yr-HP27 PLS |
50yr-HP27 FLU - 50yr-HP27 PLS |
100yr-HP27 FLU - 100yr-HP27 PLS |
|
Z |
-3.733b |
-3.846b |
-3.934b |
-3.829b |
-3.928b |
-3.928b |
-4.024b |
|
p-value |
0.000 |
0.000 |
0.000 |
0.000 |
0.000 |
0.000 |
0.000 |
b= based on negative ranks
Figure 4. Wilcoxon nonparametric test ranks, negative (HP27 FLS < HP27 PLS), positive (HP27 FLS > HP27 PLS), ties (HP27 FLS = HP27 PLS).
Discussion
Overall results of the predicted peak flows by HP11 and HP27 hydrological procedures for all ARIs and basins in the study area are attached as “Appendix B”. Notable variations in peak flows were observed across the catchments, influenced by differences in ARIs, land-use scenarios, and catchment characteristics. A general pattern noticed is the increment of the discharge under future land-use (FLU) compared to present land-use (PLS) reflecting the effects of urbanization and anthropogenic land-use changes. The other pattern observed is that HP11 hydrological procedure predicted higher peak flows when compared with HP27 across most of the simulated ARIs. The extent of this increase differs between catchments, indicating complex interactions among catchment size, stream length, and land management practices.
Figure 5 shows the increment of the peak flows for all basins und 100-yr ARI condition. It can be noticed that the increment occurred mostly in the catchment where significant urbanization is projected. Catchments such as L8, L13, and L20 are expected to experience the highest increment in peak flows under future land-use conditions with percentage values of 39%, 40%, and 45% respectively. On the other hand, L2 catchment (Kg. Bangkit Besar) shows no change in peak flows when comparing both PLS and FLU conditions, reflecting the absence of anticipated land-use changes in that area.
Figure 5. Land-use effects on peak flows at 100-yr ARI.
Figures 6 and 7 show the relationship between basin area and peak flow, and stream length and peak flow, respectively. According to Figure 6, it can be noticed that there is a strong linear relationship between catchment area and peak flow with correlation coefficient (R2) exceeding 0.96, indicating that basin area is a dominant factor controlling peak discharge for both hydrological procedures, HP11 and HP27. However, the regression lines show noticeable differences depending on the used tool even for the similar land-use condition. The HP11 produced the highest peak flows for all basin consistently when compared with HP27 PLS which reflects methodological differences in hydrological estimation: HP11 tends to yield larger discharges, while HP27 PLS gives comparatively conservative estimates. Importantly, the HP27 FLU line lies above the HP27 PLS line, demonstrating the influence of projected land-use changes on flood peaks. The slope coefficient difference between HP27 FLU and HP27 PLS (4.55 and 3.50) highlights that even moderate land-use changes can substantially amplify flood risk at larger basin scales.
Similar trends were observed when plotting the relationship between stream length and peak flow (see Figure 7). However, the correlation coefficient (R2) was lower, ranging between 0.84 and 0.90. When looking into the slope coefficient of HP11 and HP27 PLS (29.63 and 14.77, respectively) it can be noticed the major differences on the effects of stream length on the prediction of peak flows using these two hydrological procedures.
Figure 6. Relationship between basin area and peak flow for 100-yr ARI.
Figure 7. Relationship between stream length and peak flow for 100-yr ARI.
Figure 8 compares the trends of small and large catchment relating to different ARIs and different hydrological procedures. For the large catchment (L1), peak flows increase steadily with ARI, reaching values above 400 m³/s under the HP11 scenario for the 100-year ARI. Both HP27 scenarios (PLS and FLU) produced lower flows than HP11, but the FLU scenario consistently showed higher peaks than PLS, reflecting the influence of projected future land-use changes. For the small catchment (L5), peak flows are significantly lower, remaining below 30 m³/s even at the 100-year ARI. The differences between the three methods are relatively minor compared to the large basin. However, future land-use changes (FLU) amplify peak flows more noticeably in large catchments than in small ones, suggesting that urbanization and impervious surface expansion will have a disproportionately higher impact on flood risk in larger drainage areas.
Figure 8. Peak flow pattern for large and small catchments at different ARIs.
The observed variability across catchments indicates that hydrological response is scale dependent. Larger basins occasionally show attenuated peaks under extreme ARIs, possibly due to storage and channel routing, whereas smaller basins exhibit consistent proportional increases regardless of event size. Medium basins combine both effects, showing amplified peaks at both frequent and extreme ARIs. The findings highlight the necessity of integrating land-use planning with hydrological risk assessments. Moreover, urbanization consistently elevates flood peaks in most basins, with small catchments being especially vulnerable due to limited buffering capacity. For larger basins, inconsistent behavior at higher ARIs suggests that floodplain storage, soil infiltration, or management interventions can mitigate extreme-event peaks. To manage these risks, localized strategies such as enforcing development controls in small and medium basins, enhancing green infrastructure, and maintaining floodplain storage in large basins are recommended.
The findings of this study support previous findings that both Snyder- and Clark-based modelling approaches can effectively represent watershed flood response while producing distinct peak discharge estimates. Prior research has demonstrated that although both models can reproduce hydrograph timing with high accuracy, differences in peak magnitude arise from their contrasting representations of runoff translation and storage processes (Wałęga et al., 2011). Consistent with this understanding, the higher design peak discharges obtained using HP11 relative to HP27 highlight the sensitivity of flood estimation to model structure, particularly under higher return periods and increased imperviousness conditions. The observed amplification of peak flows under future land-use scenarios further confirms the dominant role of watershed response time and storage characteristics in controlling flood magnitude. These results emphasize that hydrological procedure selection constitutes a critical source of uncertainty in design flood estimation and should be carefully considered in catchment planning and infrastructure design (Wałęga et al., 2011).
Conclusions
This study presented a comparative assessment of HP11 and HP27 hydrological procedures for simulating flood peak flows in Langkawi Island river basins under both current and future land-use conditions. The findings highlight that HP11 generally predicts higher peak discharges compared to HP27 across most ARIs, with notable differences observed at higher return periods such as the 100-year ARI. The increase in peak flows under future land-use scenarios further emphasizes the influence of urbanization and impervious surface expansion on flood risk. These results underline the importance of carefully selecting hydrological procedures when designing flood management infrastructure, as the choice of method significantly affects the magnitude of estimated discharges. Moreover, incorporating future land-use projections into hydrological analysis is crucial for ensuring resilient and adaptive water resource planning. Overall, this study contributes valuable insights into the applicability of HP11 and HP27 in Malaysia and supports informed decision-making for sustainable flood risk management. A key limitation of this paper is the unavoidability of the observed data for the studied watersheds, which limited direct validation of the hydrological procedures peak flow estimations. Consequently, the comparison between the Snyder and Clark procedures is based on their relative predictive behavior under identical input conditions, putting into consideration that all used parameters represent the real watersheds characteristics. For future studies it is recommended to incorporate observed data to allow model calibration and validation. Collectively, the study fulfills its objectives by not only comparing the peak discharge estimates of HP11 and HP27 but also evaluating their relative performance and sensitivity to future land-use changes for improved flood risk management.
Acknowledgement
The authors would like to thank the government of Malaysia through its implementing agency, the Department of Irrigation and Drainage (JPS/DID) for providing the required data and information. An acknowledgment also goes to Znk Consult Sdn. Bhd. which has been appointed to conduct the hydrological study of The Integrated Shoreline Management for Negeri Kedah under the 12th Malaysia Plan. This work was supported in part by UTHM Publisher's Office via publication fund E15216.
Compliance with ethics guidelines
The authors declare they have no conflict of interest or financial conflicts to disclose.
This article contains no studies with human or animal subjects performed by the authors.
References
- Hussain Shah, Syed Muzzamil; Yassin, Mohamed A; Abba, Sani I; Lawal, Dahiru U; Hussein Al-Qadami, Ebrahim Hamid; Teo, Fang Yenn et al. 2023. Flood Risk and Vulnerability from a Changing Climate Perspective: An Overview Focusing on Flash Floods and Associated Hazards in Jeddah. Water. 15(20).
- Shah, Syed Muzzamil Hussain; Mustaffa, Zahiraniza; Teo, Fang Yenn; Imam, Mansoor Abdul Hamid; Yusof, Khamaruzaman Wan; Al-Qadami, Ebrahim Hamid Hussein. 2020. A review of the flood hazard and risk management in the South Asian Region, particularly Pakistan. Scientific African. 10. https://doi.org/10.1016/j.sciaf.2020.e00651
- Al-Qadami, Ebrahim; Razi, Mohd Adib Mohammad; Shah, Syed Muzzamil Hussain; Pu, Jaan H; Amran, Mugahed; Huenchuan, Marco Antonio Díaz et al. 2024. Floodwaters and vehicle hydrodynamics: A deep dive into risk mitigation unraveling vehicle stability in floods. Results in Engineering.
- Elfithri, Rahmah; Mokhtar, Mazlin; Abdullah, Md Pauzi. 2021. Water and environmental sustainability in Langkawi UNESCO Global Geopark, Malaysia: issues and challenges towards sustainable development. Arabian Journal of Geosciences. 14(12).
- Förster, Johannes; Mcleod, Elizabeth; Bruton-Adams, Mae M; Wittmer, Heidi. 2019. Climate change impacts on small island states: Ecosystem services risks and opportunities. Atlas of Ecosystem Services: Drivers, Risks, and Societal Responses.
- Rafique, Ahmed; Burian, Steven; Hassan, Daniyal; Bano, Rakhshinda. 2020. Analysis of operational changes of Tarbela Reservoir to improve the water supply, hydropower generation, and flood control objectives. Sustainability. 12(18).
- Khor, Jen Feng; Lim, Steven; Ling, Lloyd. 2023. Evaluating the effect of deforestation on decadal runoffs in Malaysia using the revised curve number rainfall runoff approach. Water. 15(7).
- Ata, Frankie Marcus; Toriman, Mohd Ekhwan; Desa, Safari Mat; San, Liew Yuk; Kamarudin, Mohd Khairul Amri. 2023. Impact of Land Use Activities On the Hydrological Regime in The Junjung River Basin, Penang Island, Malaysia. Planning Malaysia. 21.
- Jumaat, Muhamad Haris; Alias, Nor Eliza; Yusop, Zulkifli; Haniffah, Mohd Ridza Mohd. 2018. Modelling the Flood Scenarios and Land Use Changes in Sungai Selangor Basin. International Conference on Intelligent Information Technologies.
- Iresh, A D S; Dilthara, GWAS; Sugeeshwara, S P C. 2024. Estimation of Catchment Parameters of Snyder's Synthetic Method for Water Resources Planning and Flood Management in Sri Lanka. Engineer: Journal of the Institution of Engineers, Sri Lanka. 57(2).
- Zanial, Wan Norsyuhada Che Wan; Malek, Marlinda Abdul; Reba, Mohd Nadzri Md; Zaini, Nuratiah; Ahmed, Ali Najah; Sherif, Mohsen et al. 2023. Rainfall-runoff modelling based on global climate model and tropical rainfall measuring mission (GCM-TRMM): A case study in Hulu Terengganu catchment, Malaysia. Heliyon. 9(5).
- Jabbar, Laith Abdulsattar; Khalil, Ibrahim Abdulrazak; Sidek, Lariyah Mohd. 2021. HEC-HMS hydrological modelling for runoff estimation in Cameron Highlands, Malaysia. International Journal of Civil Engineering and Technology. 12(9).
- Mohammed, Aiman Fahd Mahmood; Adnan, Mohd Shalahuddin; Muneer, Amgad; Sadeq, Safwan. 2021. Flood Estimation Studies Using Hydrologic Modelling System (HEC-HMS) For Batu Pahat River Malaysia. 2021 Third International Sustainability and Resilience Conference: Climate Change.
- Ata, Frankie Marcus; Toriman, Mohd Ekhwan; Desa, Safari Mat; San, Liew Yuk; Kamarudin, Mohd Khairul Amri. 2023. Development of hydrological modelling using HEC-HMS and HEC-RAS for flood hazard mapping at Junjung river catchment. Planning Malaysia. 21.
- Ismail, Habibu; Kamal, Md Rowshon; Hin, Lai Sai; Abdullah, Ahmad Fikri. 2020. Performance of HEC-HMS and ArcSWAT Models for Assessing Climate Change Impacts on Streamflow at Bernam River Basin in Malaysia.. Pertanika Journal of Science & Technology. 28(3).
- Ramly, Salwa; Tahir, Wardah. 2016. Application of HEC-GeoHMS and HEC-HMS as rainfall–runoff model for flood simulation. ISFRAM 2015: Proceedings of the International Symposium on Flood Research and Management 2015.
- Wałęga, Andrzej; Grzebinoga, Magdalena; Paluszkiewicz, Bartłomiej. 2011. On using the Snyder and Clark unit hydrograph for calculations of flood waves in a highland catchment (the Grabinka River example). Acta Sci. Pol., Formatio Circumiectus. 10(2).
- Hassan, Mohamad Hafiz; Ghazali, Harraz Nuruddeen. 2019. JPS Hydrological Procedures: An Update.
- Ahmad, Muhammad Masood; Ghumman, Abdul Razzaq; Ahmad, Sajjad. 2009. Estimation of Clark’s instantaneous unit hydrograph parameters and development of direct surface runoff hydrograph. Water resources management. 23(12).
- Rajkumar, S; Mohanarajah, S; Junaid, H M. 2019. Effect of Time-Area Percent Curves in Development of Clark Model Unit Hydrograph. Engineer: Journal of the Institution of Engineers, Sri Lanka. 52(1).
License
License
Copyright (c) 2026 by Authors

This work is licensed under a Creative Commons Attribution 4.0 International License.


