
Comparative Analysis of Photogrammetry Tools for Monitoring Trench and Pipeline Progress Towards Sustainable Construction
Downloads
Contents
Abstract
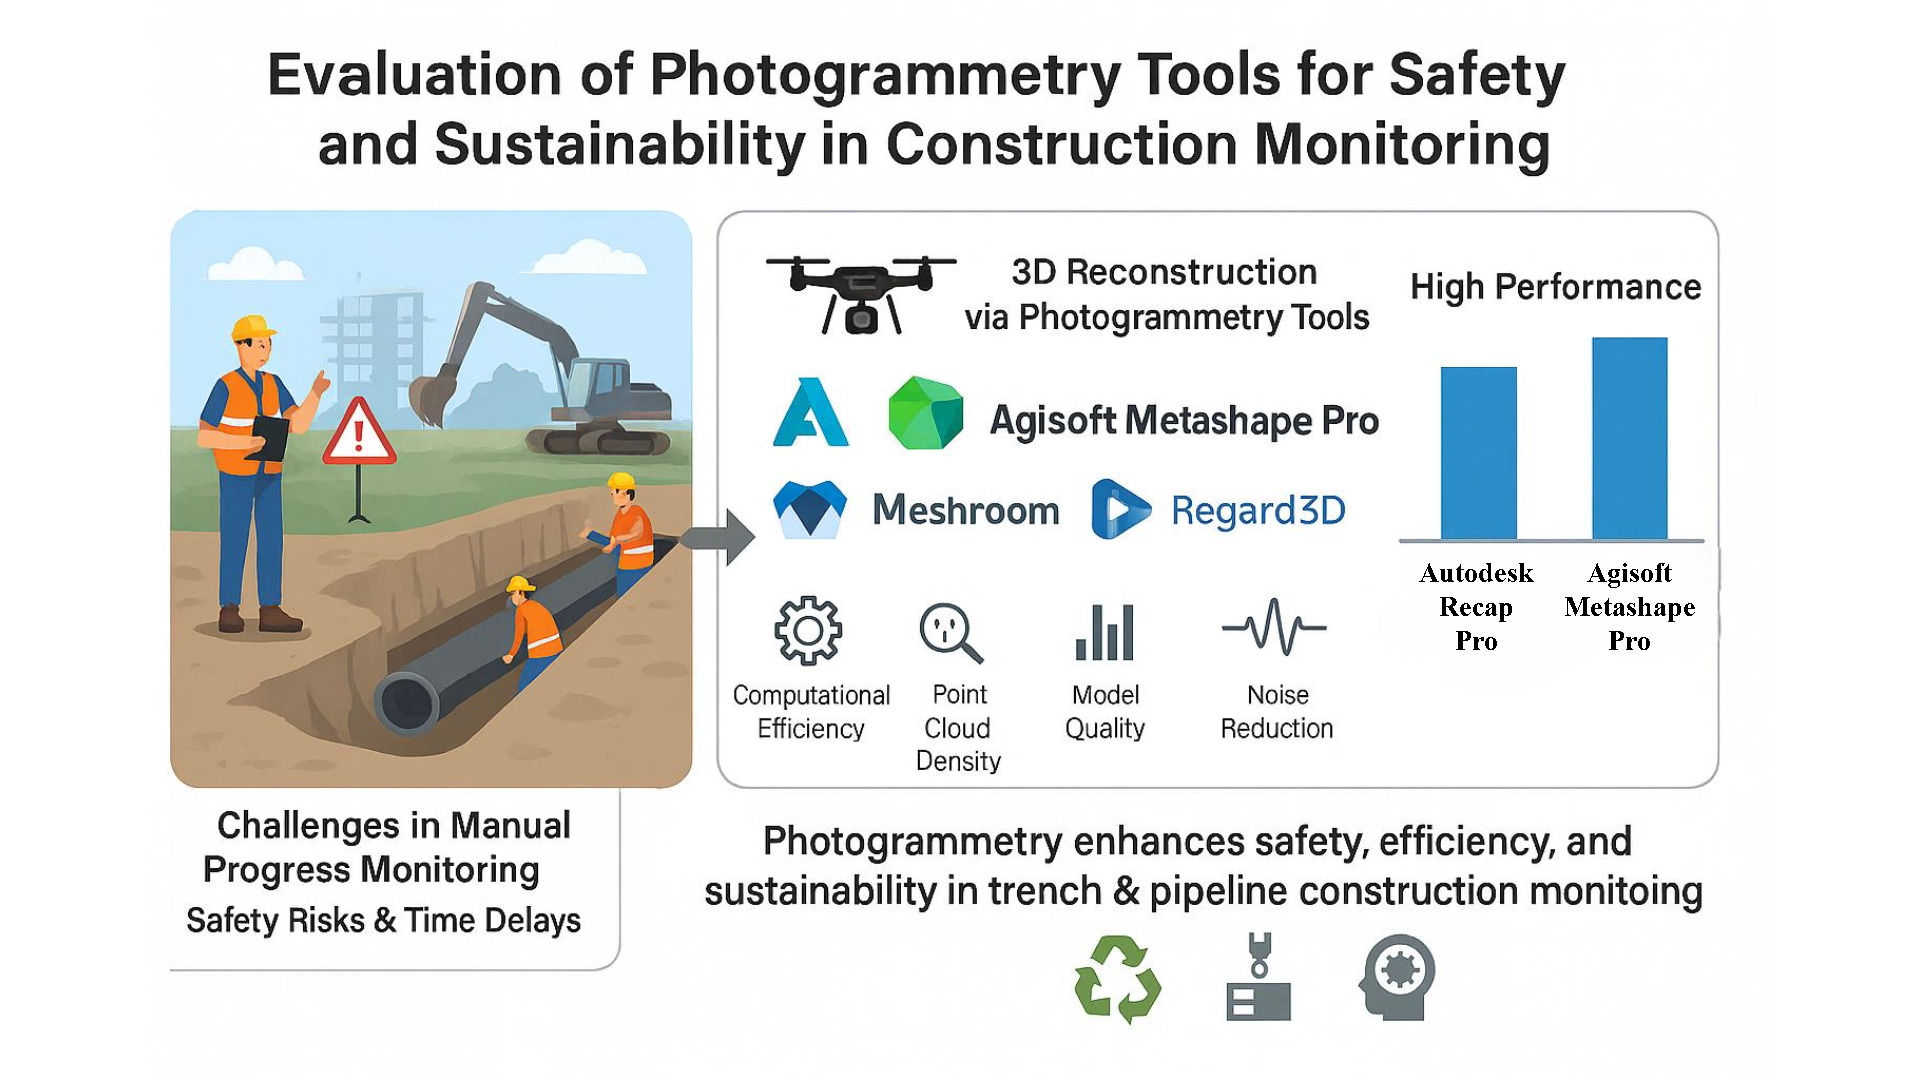
The construction of trenches and pipelines is essential to the infrastructure sector, but because of safety and technical concerns, progress monitoring is difficult. This study assesses how well photogrammetry, a cost-effective and adaptable Industry 4.0 technology, can improve safety and sustainability in construction monitoring. The graphical user interface, computational efficiency, point cloud density, model quality, percent completion, and noise in the produced 3D models were the criteria used to evaluate the six photogrammetry tools: Autodesk Recap Pro, Agisoft Metashape Pro, COLMAP, VisualSFM, Meshroom, and Regard 3D. Performance under specified conditions was examined using a trench and pipeline dataset. The results show that Agisoft Metashape Pro and Autodesk Recap Pro performed exceptionally well, offering thorough and precise 3D reconstructions with excellent models and low noise. This research promotes the use of photogrammetry by emphasizing its advantages over conventional methods in terms of affordability and sustainability. It highlights photogrammetry's contribution to resilient and sustainable practices and provides industry experts with advice on how to choose appropriate methods for tracking building progress. The results help stakeholders feel more confident about implementing photogrammetric technologies that are suited to various building settings.
Introduction
The construction sector has realised the immediate need to provide quick, precise, and accessible insights into the present state of projects (Bosché et al., 2015). Construction progress must be monitored continuously since it has been highlighted as a significant component of project success (Pazhoohesh & Zhang, 2015). Due to the significant effort that professionals are required to complete, manual progress monitoring may prove to be inefficient, expensive, or possibly both (Pal et al., 2023). Monitoring construction progress is a critical factor for ensuring project success, yet traditional manual methods often prove inefficient and error prone (Rebolj et al., 2017). Accurate progress tracking not only ensures timely project delivery but also plays a vital role in maintaining safety and resource management (Paneru & Jeelani, 2021). Existing studies have explored various automated techniques, including photogrammetry, laser scanning, RFID, and GPS, to overcome the limitations of manual monitoring (Rao et al., 2022; Yalcinkaya & Singh, 2015). Among these, photogrammetry has gained significant attention for its cost-effectiveness, versatility, and ability to provide detailed 3D reconstructions from simple image data (Balado et al., 2025; Bilal et al., 2016). However, a comprehensive evaluation of photogrammetry tools specifically designed for trench and pipeline construction remains underexplored (Knodell et al., 2023; Mahami et al., 2019). Consequently, it is not unexpected that construction progress monitoring has received a lot of study interest (Kopsida et al., 2015; Ma et al., 2024). As a result, the number of suggested techniques is increasing at an exponential rate. Furthermore, to increase accuracy and decrease labour and human error, researchers are enhancing the construction progress monitoring process by employing data-acquisition technology (Musarat et al., 2024; Omar & Nehdi, 2018).
Among the technologies utilised are Image-based methods, Laser Scanning (LS), Videogrammetry, and Photogrammetry. Additionally, tagging technologies such as Radio Frequency Identification (RFID) and ultra-wideband (UWB) are employed (Radman et al., 2022; Turkan, 2012). Global Positioning Systems (GPS) and wireless sensor networks (WSN) are also recognized as effective tools in this field. However, imaging techniques are mostly utilised by researchers in their studies, and Structure from Motion (SfM) is one of the most adopted and commonly used in imaging technology to generate 3D point cloud models from images, and this approach is adopted in various software applications (Alizadehsalehi & Yitmen, 2016). It helps users to efficiently generate 3D models after image acquisition, which are not captured in calibrated setups or aren’t specifically considered enhanced lighting conditions during the capturing process (Moselhi et al., 2020). Furthermore, for working in most photogrammetry software, users do not require high-end hardware or system requirements (Pučko et al., 2018). The 3D reconstruction process is generally comprised of six steps: data acquisition (insert images), feature detection or matching (align images), sparse point cloud reconstruction, dense point cloud reconstruction, meshing or surface modelling, and model texturing (Javadnejad et al., 2021).
In imaging techniques, photogrammetry provides a decent 3D reconstruction process with dense point cloud modelling when the process is optimised with efficient tools. Laser scanning can provide dense 3D point cloud models with high accuracy (Fu et al., 2021; Xu et al., 2020). Furthermore, laser scanning can provide direct generation of a 3D point cloud model after scanning the object or scene, but photogrammetry requires following various pre-processing steps before generating a point cloud-based 3D model, However, photogrammetry tools provide several options during pre-processing as it is divided into various stages such as (1) spare 3D point cloud generation, (2) 3D dense model generation, (3) mesh generation, and (4) texturing; to enhance the model with defined requirements or the user can tweak the model according to the required outcome (Gagliolo et al., 2018). In addition, the photogrammetry technique is an economical option as compared to laser scanning, as laser scanning is not easy to handle, as it is heavy and requires sufficient technical skills to operate laser scanning devices (Noordermeer et al., 2021). Nowadays, computer vision and photogrammetry have undergone substantial advancements to create enhanced and very detailed 3D point cloud models (Al Khalil, 2020; Vinodkumar et al., 2024). For data acquisition, images can be captured by using any device, i.e., smartphone camera, digital camera, drone, or camera mounted on Unmanned Ground Vehicles (UGVs) (Shao et al., 2016; Su, 2021). Through the photogrammetry process large area can be covered with the use of drones, as compared to laser scanning, in which point-by-point scanning is required; it is precise but time-consuming. Photogrammetry can be very useful in challenging indoor environments, whereas laser scanning can be impractical because of its operational and equipment setup difficulties (Shao et al., 2016). Furthermore, photogrammetry naturally captures colour information along with the 3D geometry of the object or scene. Photomodelling, the process of photogrammetry, creates 3D models from photographs and images are analysed using some software (Saif & Alshibani, 2022). It follows fast image processing and alignment point cloud method during the photo modelling process. The process of data acquisition, such as capturing the pictures, is to cover the object or scene from the maximum possible angles to generate an enhanced and high-quality 3D point cloud model (Elhalawani et al., 2021; Palestini et al., 2022). A significant feature of photo modelling is preserving the chromatic features of the object under analysis, as each pixel of the image is linked with the point cloud model. The 3D model generated is in the form X, Y, and Z coordinate system, which shows the axis information of the object under observation. Moreover, achieving a high-quality 3D model generation process when utilising photogrammetry software directly affects the resolution of the photogrammetric point cloud, and it relies on the dimensions of the image pixels when projected onto the surface (Huang et al., 2022). Previous research has largely focused on comparing photogrammetry tools for general applications, such as cultural heritage documentation, landscape analysis, and building element modelling (Colomina & Molina, 2014; Selvaggi et al., 2018). For instance, studies have demonstrated the potential of tools like Agisoft Metashape, Pix4Dmapper, and Autodesk Recap in generating accurate 3D models (Casella et al., 2020; Jarahizadeh & Salehi, 2024).
Although numerous studies have compared photogrammetric tools for data acquisition and as-built modelling across various objects, their systematic evaluation for trench and pipeline monitoring remains limited. Photogrammetry has been integrated into Building Information Modelling (BIM) by many researchers by presenting a concept of as-built and as-planned model comparison. In other cases, the photogrammetric model superimposed on BIM has been utilised by the researchers to provide useful information about the ongoing construction project. On the other hand, the studies focused on landscapes, buildings, historical or monumental, and archaeological structures. Ruzgiene (2007) performed a comparison of photogrammetric tools for topographic mapping. Gagliolo et al. (2018), Kingsland (2019), and Kingsland (2020) focused their study on the cultural heritage field. Furthermore, Grussenmeyer and Al Khalil (2008) used a photogrammetric software comparison strategy targeting building elements, and Vlachos et al. (2019) focused on underwater archaeological structures. In the context of construction progress monitoring, few studies have been done on building elements i.e., Qureshi, Alaloul, Murtiyoso, et al. (2022) compared photogrammetry tools concerning rebar progress identification. However, these studies often lack application-specific datasets, standardized evaluation criteria, and a focus on critical infrastructure elements like trenches and pipelines. Regarding pipeline construction, different projects may consist of various categories of pipeline construction. Furthermore, the variability in tool performance across different datasets and scenarios has not been systematically addressed, leaving industry professionals with limited guidance on selecting the most suitable tool for specific construction applications.
The conventional monitoring approach presents issues for long-distance pipelines, but they can be minimised by using modern data-acquisition technologies. Conventional monitoring approaches face challenges with long-distance pipelines, including safety risks like trench collapse and technical issues such as manual volume estimation. Deviations from planned estimates can cause over- or under-excavation, complicating project management. Modern data-acquisition technologies can mitigate these issues, yet research on their efficient use in pipeline construction remains scarce. This study addresses these gaps by evaluating six photogrammetry tools for 3D modelling of trenches and pipelines. It introduces an evaluation framework using visual and numerical criteria, such as computational efficiency, model quality, and noise assessment, to identify the most suitable tools. Accordingly, the primary objective of this study is to systematically evaluate and compare six photogrammetry tools, Autodesk Recap Pro, Agisoft Metashape Pro, COLMAP, VisualSFM, Meshroom, and Regard3D, for their effectiveness in trench and pipeline construction progress monitoring, using both visual and numerical criteria to identify their strengths, limitations, and practical implications. The findings of this study contribute to sustainable construction practices by offering low-cost, safe, and efficient alternatives to manual monitoring. This is particularly significant for hazardous trench environments, where photogrammetry enables remote, high-quality data acquisition and analysis, thereby improving project management efficiency and worker safety.
Literature Review
A systematic literature review was conducted to shortlist the most used photogrammetric tools. For this reason, relevant articles were searched by using the Scopus database. Articles published within the last 5 years were considered during the article search on the database. The search query “(photogrammetry OR photo modelling OR sfm) AND (image OR picture OR photo) AND (tool OR technique)” was used. It reveals numerous studies in which various photogrammetric tools were utilised for 3D point cloud model generation. This structured approach ensured transparency and reproducibility of the search while allowing the identification of both open-source and commercial photogrammetry software reported in the literature. These tools are available to manage the entire or partial process of creating 3D models from photos, depending on the build architecture and available features of the photogrammetric software. These tools cover a wide range of geospatial activities, including image preparation and the creation of point clouds, Digital Surface Models (DSMs), orthophotos, mesh models, and textured models (Alidoost & Arefi, 2017). Table 1 provides a summary of the related literature, highlighting the photogrammetry tools adopted by researchers in their studies, as well as other relevant parameters.
It includes case studies of two different Unmanned Aerial Vehicles (UAVs) that captured close-range photographs of buildings, particularly a Palace and a Church. Agisoft, Pix4D, APERO-Micmac, and PhotoModeler were used to produce photogrammetry models (Delgado-Vera et al., 2017). In a different research effort, the constructed model assessed the features and capabilities of Photomodelling. The study also examined the effectiveness of photogrammetry-based software, including Agisoft Metashape, VisualSfM, and Autodesk ReMake. To instrument the precision and accuracy of Photomodelling, a modified Iterative Closest Point (ICP) algorithm was employed. This algorithm evaluated the technology's capability to accurately measure surface area, volume, and spatial dimensions (Catalucci et al., 2018). Similar research used a variety of open-source photogrammetry software packages, including Agisoft, COLMAP, Python Photogrammetry Toolbox, VisualSfM, and Regard3D. The investigation focused on their workflow, features, accuracy, and processing time. Agisoft Metashape was used to create a reference model or ground truth model (GTM). CloudCompare software was also used for the comparison of the generated 3D point cloud models (Rahaman & Champion, 2019). In another application, Pix4D and Agisoft Photoscan generated 3D representations of aquatic objects of various sizes. Three criteria, including picture alignment, total spatial error, and reprojection error, were used to assess the efficiency of each application in modelling underwater structures. The data revealed that Agisoft Photoscan excelled in picture alignment, whereas Pix4D created 3D models with reduced overall error (Burns & Delparte, 2017). Furthermore, another study focused on different photogrammetric models that were evaluated using picture data from software packages such as 3DF Zephyr, Meshroom, Agisoft, and RealityCapture. Kingsland (2020) compared Agisoft Metashape, ContextCapture, and RealityCapture photogrammetric models by capturing an artefact (aryballos).
Table 1. Summary of photogrammetry-based literature
|
Application Area |
Data Acquisition Device |
Adopted Range |
Test Object |
Photogrammetry Software |
Open Source/Paid |
Research Methodology |
Research Outcome |
Authors |
|
Cultural Heritage |
Digital Camera (Nikon D3400) |
Close- Range |
Small-Scale Artifact |
Agisoft Metashape |
Paid |
Computational/processing time comparison and visual evaluation |
Reality Capture is the fastest and most valuable option | |
|
ContextCapture | ||||||||
|
RealityCapture | ||||||||
|
Cultural Heritage |
UAV (DJI Phantom 4 Pro system) |
Long-Distance |
Historical Site |
3DSurvey |
Paid |
Accuracy evaluation (geometric and visual assessment) |
Agisoft Metashape, Pix4Dmapper Pro, and SURE performed better | |
|
Agisoft PhotoScan | ||||||||
|
Pix4Dmapper Pro | ||||||||
|
SURE | ||||||||
|
Construction |
Digital Camera (Nikon-D 3300) |
Close- Range |
Concrete Specimens, Small Sand Pile |
Agisoft Metashape |
Paid |
Smartphones and digital cameras assessment for photogrammetric accuracy |
Smartphones can produce efficient on-site photogrammetric data | |
|
Smartphone (Huawei Mate 10 lite) | ||||||||
|
Construction |
Smartphone |
Close- Range |
Rebar |
Regard 3D |
Open-Source |
Metadata and visual inspection comparison, Averaged-merged point cloud model comparison |
3DF Zephyr and Agisoft Metashape performed better | |
|
3DF Zephyr | ||||||||
|
COLMAP | ||||||||
|
Meshroom | ||||||||
|
VisualSFM | ||||||||
|
MicMac | ||||||||
|
OpenMVG | ||||||||
|
MVE | ||||||||
|
RealityCapture |
Paid | |||||||
|
PhotoModeler | ||||||||
|
Agisoft Metashape | ||||||||
|
ReCap Pro | ||||||||
|
Underwater Archaeology |
Digital Camera (Canon PowerShot A620) |
Close-Range |
Shipwreck |
Agisoft PhotoScan |
Paid |
Point cloud density, Cloud-to-cloud comparison, surface roughness and density, and a combined 3D metric were performed. |
RealityCapture and Agisoft Metashape excel in creating underwater 3D point models | |
|
RealityCapture | ||||||||
|
SURE | ||||||||
|
3D Zephyr |
Open-Source | |||||||
|
VisualSFM | ||||||||
|
Cultural Heritage |
Digital Camera (Canon EOS-M) |
Close-Range |
Historical Site |
Agisoft PhotoScan |
Paid |
Individual software evaluation, Basic comparison of tools with Agisoft and TLS as reference |
Analysis of the point cloud model shows good quality in all software, except for Insight 3D; all other software enables GCP selection | |
|
Pix4Dmapper | ||||||||
|
ContextCapture | ||||||||
|
UAV (Microcopter Hexacopter) |
Long-Distance |
VisualSFM |
Open-Source | |||||
|
insight3D | ||||||||
|
MicMac | ||||||||
|
Archaeology |
Digital Camera (Nikon D5200) |
Close-Range |
Historical Site |
Agisoft PhotoScan |
Paid |
Analytical Evaluation, Cloud-to-cloud distances, average point distances, standard deviation among models |
SfM models from either software are comparable across conditions. (UAV photographs show the least distance between points as compared to terrestrial photography | |
|
UAV (A DJI Phantom 4 Pro) |
Long-Distance |
Autodesk Recap Photo | ||||||
|
Cultural Heritage |
Digital Camera (Canon EOS 600D) |
Close-Range |
Historic Building, Frog Sculpture |
Agisoft Metashape |
Paid |
Comparison performed on the offered features, workflow, computational time, and accuracy |
Best option Regard 3D for its convenient GUI, low computational time, and no programming knowledge to use | |
|
COLMAP |
Open-Source | |||||||
|
Python Photogrammetry Toolbox | ||||||||
|
VisualSfM | ||||||||
|
Regard3D | ||||||||
|
Underwater Archaeology |
Marine Imaging Camera (SeaArray: Nikon Z7) |
Close-Range |
Construction Wreck |
Agisoft Metashape |
Paid |
Statistical analysis, Amount of time and resources evaluated for accurate 3D model creation (SeaArray and Agisoft utilisation) |
The SeaArray Photogrammetry system can accurately depict underwater features | |
|
Geology |
UAV (DJI Phantom 4 Pro) |
Long-Distance |
Rock (outcrop) |
Agisoft Metashape |
Paid |
Accuracy evaluation by quantifying the error between the model and the field survey points |
ContextCapture creates the most effective models for geotechnical investigation |
The data acquisition capturing process involved three angles: high, middle, and low. In a similar application area, cultural heritage, Alidoost and Arefi (2017) covered a historical site situated in the city of Harrireh, Kish Island, Iran. By using UAV operation, the historical site was captured with 300 aerial photos with 70-80 % overlap. After filtering, 89 images were retained for photogrammetric 3D modelling. DSM was also generated over historical sites. Furthermore, detailed characteristics of photogrammetric software packages were also provided. Considering cultural heritage applications, Gagliolo et al. (2018) performed both close-range (digital camera) and aerial (UAV) based data-capturing processes, while Rahaman and Champion (2019) only focused on close-range image capturing methods for their study. Gagliolo et al. (2018) performed an in-depth assessment of the photogrammetry software under study and provided a characteristic report in a summarised format to understand the features and workability of the tools. Terrestrial Laser Scanning (TLS) was also performed in comparison with photogrammetric-generated models. In this study, Agisoft Metashape is considered the reference software to compare with Pix4Dmapper, ContextCapture, VisualSFM, insight3D, and MicMac. On the other hand, Rahaman and Champion (2019) considered free and open-source (FOSS) software for comparing photogrammetric tools. Two datasets were utilised to compare the 3D point cloud models generated by using selected FOSS software. By taking into consideration the application of photogrammetry in the field of archaeology, Vlachos et al. (2019) evaluated the application of Structure from Motion (SfM) and Multi View Stereo (MVS) techniques for generating 3D point models of submerged archaeological sites. Agisoft Photoscan, VisualSFM, SURE, 3D Zephyr, and Reality Capture were used for comparison. Two datasets were created; the first dataset was composed of 19 images taken by a small camera with an object-to-camera distance of 1 meter. The second dataset was developed by capturing 42 images with a large camera and object-to-camera distance maintained at 3 meters. In relation, Jones and Church (2020) considered both UAV photography and terrestrial photography by comparing two photogrammetry software, Agisoft PhotoScan (v.1.4) and Autodesk ReCap Photo (v.2018). Like underwater archaeology applications, Wright et al. (2020) evaluated the SeaArray Photogrammetry system by generating 3D models in the working environment of Agisoft Metashape.
In the construction application area, Saif and Alshibani (2022) performed a comparison between digital and smartphone cameras by generating photogrammetric 3D point cloud models on Agisoft Metashape. Lens distortion, image alignment, and 3D reconstruction, sparse point cloud, dense point cloud, polygonal and texture modelling, scale bar error evaluation, and geometric measurement extraction were the parameters involved during the evaluation steps. In a similar application area, Qureshi, Alaloul, Hussain, et al. (2022) performed an extensive comparison of photogrammetric tools by considering 12 open-source and paid software. The research study was also aligned with the perspective of construction progress monitoring. Generated rebar 3D point cloud models were also compared with GTM. In the geology sector, Becker et al. (2018) performed photogrammetry software evaluation for rock mass characterization. The study was performed to enhance geotechnical investigation procedures with digital technologies.
A review of prior studies shows that the majority of photogrammetry software evaluations have been carried out in cultural heritage (Alidoost & Arefi, 2017; Gagliolo et al., 2018; Kingsland, 2020; Rahaman & Champion, 2019), archaeology (Jones & Church, 2020), and underwater applications (Vlachos et al., 2019; Wright et al., 2020), with a smaller number of studies focusing on construction-related datasets such as rebar modelling (Qureshi, Alaloul, Hussain, et al., 2022) or small-scale concrete specimens (Saif & Alshibani, 2022). These studies demonstrate that tools such as Agisoft Metashape, Pix4D, and RealityCapture frequently perform well across different applications. However, despite these advances, a clear gap exists in applying photogrammetry evaluations to trench and pipeline construction. Existing comparisons rarely address the unique challenges of trench depth and pipeline geometry, leaving industry professionals without clear guidance on tool suitability for these contexts. Therefore, this study contributes by systematically evaluating six photogrammetry tools (Autodesk Recap Pro, Agisoft Metashape Pro, COLMAP, VisualSFM, Meshroom, and Regard3D) on trench and pipeline datasets using a standardized framework. This focus distinguishes it from previous comparisons and provides domain-specific insights for infrastructure construction progress monitoring.
Methodology
The following criteria were taken into consideration when developing the methodology to evaluate the best option among the photogrammetry tools that are currently available on the market. This allowed for the shortlisting of the photogrammetry software. Figure 1. Displays the overall strategy adopted in the research to determine the most suitable photogrammetry tool. The comprehensive selection and testing methodology has been structured into four distinct stages. The first stage involves the selection of shortlisted photogrammetry tools for comparison. Once the tools are chosen, the second stage is to create a dataset by capturing the trench and pipeline physical model object. With the dataset created, the third stage revolves around creating photogrammetric 3d point cloud models. This conversion of the real scene into a three-dimensional representation is known as 3d reconstruction. Finally, the fourth stage entails statistical data or visual assessment, and performing numerical analysis of the data collected from photogrammetric 3d point cloud models. Each photogrammetry tool was configured according to the developer-recommended guidelines, ensuring consistency in model generation. The dataset was prepared under controlled conditions, with specific overlaps and lighting parameters documented to allow replication. The findings may be influenced by factors such as the default processing settings of individual tools and the dataset trench and pipeline characteristics. The evaluation framework adopted in this study was informed by the approach of Qureshi, Alaloul, Hussain, et al. (2022), who compared photogrammetry tools for rebar detection in construction monitoring. While their framework provided a valuable reference, the present research extends the methodology to trench and pipeline datasets, thereby addressing a different application area within infrastructure monitoring. Future studies should assess these tools across diverse datasets and configurations to validate generalizability.
Figure 1. Research flow chart.
Selection of Photogrammetry Tools
Considering the nature of pipeline and trench construction in the pipeline construction industry, the photogrammetric software eligibility is based on two factors in pipeline categories, i.e., pipelines in MEP settings (crowded in complex construction environments) and long-distance pipelines. In these scenarios, photogrammetric tools were considered with both close-range and long-distance 3D point cloud modelling ability. Furthermore, the approach was developed to identify the photogrammetry tools that are most used by researchers (considering the high adaptability of tools), based on a review of existing literature. Additionally, keeping the understanding of cost-effectiveness and basic skills requirements to understand the workability of the photogrammetry tools. Furthermore, computational efficiency, availability of user support and community, as well as compatibility with industry-specific data formats. By considering the above-mentioned selection criteria, the shortlisted photogrammetric tools are Autodesk Recap Pro, COLMAP, VisualSFM, Meshroom, Regard 3D, and Agisoft Metashape Pro. Table 2. Presents the details of basic features offered by the selected photogrammetry software.
Data Acquisition
Physical pipeline and trench model
A physical model of the pipeline and trench was built using a transparent plastic box with dimensions (length of 45 in, width of 16.5 in, and height of 13 in). The size of the transparent plastic box does not matter in this application, as this box was built to work in a laboratory environment having limited space to place this model. However, in terms of real-site application, this strategy can easily be adopted because of the photogrammetry technique being used, which can cover large-scale areas. Although this physical model was built in a laboratory environment, its nature is very close to a real onsite trench and pipeline construction environment. The model shape was built in consideration of the real trench shape and materialistic nature. Sandy soil and steel pipe were the materials procured to build this model. Afterwards, a pipeline was also fixed just above the base of the trench. Figure 2. Displays the dataset developed for the physical model of the pipeline and trench.
Dataset
The images were captured using a Samsung A51 smartphone camera (Samsung SM-A515F) while keeping the default setting of the camera to ensure the adaptability of the camera with any settings from other smartphones as well. The data collection technique takes angles from the high, middle, and low angles as shown in Figure 2. All pictures were taken in the daylight, so no flashlight was used. The pictures were taken by steadily moving around the object to completely cover all sides of the object. During the image-capturing process, no tripod stands were used to capture steady images; this strategy was adopted to keep the procedure simple and convenient for the users at the construction site. This approach eliminates the need for arranging multiple devices or tools for data acquisition.
Table 2. Shortlisted photogrammetry software details
|
Software |
Developer |
Software Feature s | ||
|
Compatible Operating System |
License Type |
Supported Export File Format (Point Cloud) | ||
|
Autodesk Recap Pro |
Autodesk, Inc. |
Windows, macOS, Linux |
Commercial, Educational |
.e57, .pts, .rcp, .rcs |
|
Agisoft Metashape Pro |
Agisoft LLC |
Windows, macOS, Linux |
Node-Locked, Floating, Educational, 30-day Trial |
.obj, .ply, .las, .laz, .e57, .pts, .pcd, .txt, .zip, .copc.laz, .slpk, .u3d, .dxf, .cl3, .pdf |
|
COLMAP |
Johannes L. Schoenberger |
Windows, macOS, Linux |
BSD License(Free with limitations) |
.nvm, .ply, .out, VRML |
|
VisualSFM |
Changchang Wu |
Windows, macOS, Linux |
Free for Personal, Non-commercial |
.ply, .obj, .out |
|
Meshroom |
AliceVision |
Windows, macOS, Linux |
Open-Source (MPLv2 license) |
.ply, .obj |
|
Regard 3D |
Roman Hiestand |
Windows, macOS, Linux |
Full-Free (MIT License) |
.ply, .obj |
Figure 2. Sample images of the pipeline and trench physical model. (a-c) High-angle views, (d-f) middle-angle views, and (g-i) low-angle views of the model. Each part showcases different perspectives of the setup.
Data Processing/3D Reconstruction
The evaluation of six photogrammetry tools, VisualSFM, Meshroom, COLMAP, Autodesk Recap Pro, Regard 3D, and Agisoft Metashape Pro, involved creating 3D point cloud models from image-based information. The generated 3D photogrammetric models can be seen in Figure 3. The implementation followed software developer instructions, with a focus on using high or extreme program settings and in some tools, default settings were used to optimise for the most precise and thorough results and follow a consistent strategy for comparison. All the processes of the software were performed on the same machine. Furthermore, during the processing of 3D reconstruction in software, no other simultaneous activities, such as background software and processes, were carried out. Furthermore, the skills to use these photogrammetric tools were developed by following the guidelines and instructions available on the developer’s website, internet sources, and community websites. It means that at the time of using these photogrammetric tools, the authors have the same level of experience using these programs. All photogrammetric 3D point cloud models were first developed in six shortlisted tools and afterwards for comparison Girardeau-Montaut (2016) open-source software was used. The workstation, a Dell Precision 5530, was utilised for simulation and 3D reconstruction process on photogrammetry tools. Its specifications include an Intel Core i9-8950HK, supported by memory of 32 GB, an integrated Intel UHD Graphics 630 GPU, and a dedicated Nvidia Quadro P2000 GPU.
Visual Assessment/Statistical Data And Numerical Analysis
The evaluation framework was designed to reflect both the technical performance and practical usability of photogrammetry tools in trench and pipeline applications. Six criteria were selected: (i) Graphical User Interface (GUI) and features, to assess usability in real project environments; (ii) computational processing time, critical for time-sensitive progress monitoring; (iii) point cloud density, which directly influences the ability to capture pipeline and trench details; (iv) 3D model quality, representing the overall reconstruction fidelity; (v) percentage model completion, ensuring that the full trench and pipeline geometry is represented; and (vi) percentage noise, to quantify the presence of false or irrelevant points that may affect accuracy.
|
Agisoft Metashape Pro |
VisualSFM |
|
Meshroom |
Regard3D |
|
Autodesk Recap Pro |
COLMAP |
Figure 3. Photogrammetric 3D point cloud models developed using different software: (a) Agisoft Metashape Pro, (b) VisualSFM, (c) Meshroom, (d) Regard3D, (e) Autodesk Recap Pro, and (f) COLMAP.
Percentage Completion of (Pipeline and Trench) Model
The percentage of completion of the generated models was assessed through numerical analysis. To achieve this, the created models were imported into CloudCompare, and their size was adjusted by using the scaling option to match the ground truth dimensions (GTDs). In each model, pipelines and trench measurements were taken separately. One complete length of the pipeline is considered for measurement in each photogrammetric 3D model, and in the trench model, only the length is considered for calculations. To analyse the percentage completion of the generated 3D point cloud model, the measured pipeline and trench length in each generated 3D point cloud model were compared with the GTD of the pipeline and trench dataset. Equation 1 was used to calculate percentage completion for the pipeline, whereas Equation 2 was used to calculate percentage completion in each trench, in each model.
Percentage Noise
Calculating the percentage noise of a pipeline and trench in a 3D point cloud model involves comparing the measured dimensions of the pipeline and trench within the 3D point cloud model to ground truth dimensions (GTDs). After importing each model into CloudCompare, the trench area was cropped using a segmentation tool; the segmented area considered for calculating the noise was 122 cm x 92 cm (± 2 cm). The total count of point clouds was recorded, and areas exhibiting noise were pinpointed. Employing CloudCompare, noise removal was conducted individually for each model, followed by a re-evaluation of the point cloud count. Therefore, using Equation 3, the variance between the two measurements was evaluated to calculate the percentage of noise for each model.
Result
For complete testing, all six shortlisted photogrammetry tools have undergone in-depth analysis to produce the results, which can be concluded to decide the best possible photogrammetry tool among all tested photogrammetry software.
Visual Assessment and Statistical Data
In this evaluation stage, the state-of-the-art comparison method was adopted to produce efficient comparison results. All 3d point cloud models of trench and pipeline were generated by following the guidelines and instructions of the software developers.
GUI and Features Comparison
While using this photogrammetry software, it was found that paid licensed software provides special tutorials and guideline manuals for the users to understand the complete workflow of the software and provide every minute detail related to the software. Furthermore, the graphical user interface (GUI) of this software was very interactive and efficiently designed, which makes it easier for the user to interact with the functions and features and to find the required tools easily. While open-source tools offer different GUIs, some of them have created simple GUIs, and others have developed the photogrammetry software on formulated binary operations such as Python, MATLAB, Command Prompt (cmd), or Windows PowerShell. However, some free photogrammetry software, such as Meshroom, provides a highly interactive and easy-to-understand GUI. Along with this, it provides extensive editing options in most 3d reconstruction steps. In Agisoft Metashape Pro, in some cases, it is difficult to generate the whole 3d model in a single attempt, but with the help of the new version, Metashape offers better-enhanced models, and to overcome this difficulty, it offers the splitting of the photos into several small parts, and then following the same 3d reconstruction procedure and afterwards combining all separate models. Furthermore, the Agisoft Metashape Pro masking feature is very fast and easy to use for eliminating irrelevant elements from the scene, such as the background or any accidentally prominent elements. On the other hand, Autodesk Recap Pro, the model generation and saving files feature is different compared to other photogrammetric software. In this tool, it is required to download and install Autodesk Desktop Connector to link all generated 3D models to Autodesk Drive. Without this cloud server, 3D model generation is impossible. The processing and generation of point clouds depend on the server availability and the slots. First, during the 3d reconstruction process, all the data is uploaded to the server, and after generating the 3D model, it allows downloading the point cloud file. Furthermore, it does not allow saving the files in the local drives during the reconstruction process. However, its GUI provides convenient workability with easy access and understandable features. In contrast, the VisualSFM GUI is not efficiently designed, and it is a weak point of the software. Considering its documentation, the resources are available from the communities, but official documentation from VisualSFM is very limited, which makes it difficult for some users to understand some complex or advanced features. Considering the COLMAP software GUI and features, it supports both graphical and command-line interfaces. This software provides the functionality, which is a complete reconstruction process, without integrating each step into a manual step-by-step process. The reconstruction quality is compromised because there is no option provided to manually change the settings of each reconstruction stage to increase the accuracy of the dense reconstruction model. In the scenario of Regard 3D software, the GUI is very simple without any graphical aesthetics. The software is not built with some advanced GUI features, but still, it is easy to understand. Furthermore, the generated 3D surface can be exported to other software, such as MeshLab, for better visualisation and editing.
Computational Processing Time
After importing the images to six shortlisted photogrammetry software, the processing time starts with the first reconstruction step of each software, which is the feature detection or matching (aligning images). In certain software applications, like Autodesk Recap Pro, the picture import process requires additional time due to the pictures being uploaded to cloud services. Therefore, in these situations, the processing time for both the picture import and upload to the drive is taken into account, as these steps cannot be completed independently.
Agisoft Metashape Pro took a computational processing time of 19 minutes to complete all the steps of 3D reconstruction. Image alignment in Agisoft Metashape Pro was complete within just 1 minute. Furthermore, a sparse 3D point cloud model was also produced during the processing of image alignment. In Agisoft Metashape Pro, each 3D reconstruction stage involves some manual settings that can be modified according to the requirements. However, during the analysis of this dataset, we kept every setting on high, which is by default. The computational processing time can vary depending on the quality of the reconstruction process in the settings. Nevertheless, even in high-quality 3D point cloud generation, the computational processing time seems very normal, as shown in Table 3. Figure 4. Displays the information that 58 percent of the time was spent on the dense 3D point cloud reconstruction process, which is the maximum compared to other stages of the 3D reconstruction process.
Table 3. Time spent on each step of the 3D reconstruction process in Agisoft Metashape Pro
|
3D Reconstruction Stages (Agisoft Metashape Pro) |
Computational Processing Time (minutes) |
|
Image Alignment |
1 |
|
Build Dense Cloud (Dense 3D Reconstruction) |
11 |
|
Build Mesh (Meshing) |
5 |
|
Build Texture |
2 |
|
Total |
19 |
Figure 4. Pie chart showing proportional computational time distribution in Agisoft Metashape Pro
VisualSFM took a total processing time of 27 minutes to complete all 3D reconstruction steps. It took three runs to finally generate a dense 3D point cloud model. In the first two runs, the software performed the initial two steps, which are Image alignment and full 3D reconstruction (sparse 3D point cloud modelling) successfully, but in the third step, dense 3D reconstruction, the software crashed with some unexpected error. After all, in the third run, a dense 3d point cloud was successfully generated. Table 4. Displays the time spent in each step in VisualSFM processing. After importing images, the process from image alignment to full 3d reconstruction is continuous; however, for dense 3d reconstruction user needs to select the option manually. VisualSFM does not provide an option for meshing and texturing. By comparing computational processing time until the stage of dense reconstruction, in VisualSFM and Metashape, it can be observed that VisualSFM took 28 minutes, which is more than Agisoft Metashape Pro 12 minutes. Furthermore, 89 percent of the time was spent on dense 3D reconstruction, which is the maximum as compared to other processes, as shown in Figure 5. For instance, Agisoft Metashape Pro achieved 100% model completion with the highest point cloud density of 15,290,728 points, whereas Meshroom had only 63.77% trench model completion with a significantly lower density of 81,635 points. Tools like Meshroom performed less effectively due to limited options for dense point cloud generation and reliance on default settings that were not optimized for the trench and pipeline dataset.
Table 4. Time spent on each step of the 3D reconstruction process in VisualSFM
|
3D Reconstruction Stages (VisualSFM) |
Computational Processing Time (minutes) |
|
Image Alignment |
2 |
|
Full 3D Reconstruction (Sparse Point Cloud Reconstruction) |
1 |
|
Dense Reconstruction |
25 |
|
Total |
28 |
Figure 5. Pie chart showing proportional computational time distribution in VisualSFM
In Meshroom, the total computational processing time was 73 minutes. Meshroom processed the data generally in three major steps, as mentioned in Table 5. Meshroom processing of data at 13 minutes for combined image alignment and 3D sparse point cloud generation is more as compared to VisualSFM. However, Meshroom can also perform meshing and texturing of the generated dense 3D point cloud data, which took time of 48 minutes and 12 minutes, respectively. It can be observed that SfM and texturing almost took similar processing times in terms of percentages, 18 percent and 16 percent, respectively. Moreover, Meshroom significant amount of time (48 minutes) in the dense point cloud and meshing stage, as compared to Agisoft Metashape Pro, which took only 16 minutes. Yet as Figure 6. Illustrates, meshing took up 66 percent of the total time, which is the longest part of the process.
Table 5. Time spent on each step of the 3D reconstruction process in Meshroom
|
3D Reconstruction Stages (Meshroom) |
Computational Processing Time (minutes) |
|
SfM Process (Image Alignment, Sparse Point Cloud Reconstruction) |
13 |
|
Meshing (Dense Point Cloud, Mesh) |
48 |
|
Texturing |
12 |
|
Total |
73 |
Figure 6. Pie chart showing proportional computational time distribution in Meshroom
For Regard3D, the total computational processing time took 36 minutes. The photomatching stage took a maximum time of 19 minutes, as compared to other processes during 3D reconstruction. Table 6. Provides the information on the computational processing time of each step in Regard3D. This result contrasts with previous photogrammetric software (Agisoft Metashape Pro, VisualSFM, and Meshroom) results, in which image alignment took the minimum time as compared to later processes in the software during 3D point cloud model generation. Figure 7. Displays the information that more than half of the time of the whole process, which is 53 percent, is consumed during the process of photomatching.
Table 6. Time spent on each step of the 3D reconstruction process in Regard 3D
|
3D Reconstruction Stages (Regard3D) |
Computational Processing Time (minutes) |
|
Photomatching (Image Alignment) |
19 |
|
Triangulation (Sparse Point Cloud Reconstruction) |
1 |
|
Dense Point Cloud |
11 |
|
Surfacing (Mesh Generation, Texturising) |
5 |
|
Total |
36 |
In the case of COLMAP and Autodesk Recap Pro, the 3D reconstruction stages are not divided into several stages, which, as a result, cannot be manually interacted with by users to identify the computational processing time of each stage of reconstruction. Thus, overall computational processing was considered for comparison while evaluating and comparing these two photogrammetric tools. When comparing the computational processing time of COLMAP with other photogrammetric tools, it was observed that it took 160 minutes to generate a 3D reconstructed model, which is double the time taken by Meshroom, which is 73 minutes. The total time spent for complete processing in Agisoft Metashape Pro is the minimum, as compared to other shortlisted photogrammetry tools. Dense reconstruction consistently dominated runtime (e.g., VisualSFM and Meshroom), while ReCap’s end-to-end time also reflects cloud upload/queue overheads. Takeaway: for rapid, iterative monitoring on similar trench/pipeline scenes, Metashape provides the fastest complete pipeline on a single workstation; cloud-based ReCap shifts computing off-device but depends on network/server availability. Figure 8. Displays the complete computational processing time for each software.
Figure 7. Pie chart showing proportional computational time distribution in Regard 3D.
Figure 8. A bar graph showing the total computational processing time to process the trench and pipeline model in each software.
Point Cloud Density and Model Quality
In this evaluation, generated 3D point cloud models were considered for basic visual assessment to determine the model point cloud density, model quality, meshing, and texturizing option availability in the software. Furthermore, the model quality of each of the generated 3D models has been measured by considering a scale between ‘very high’, ‘high’, ‘medium’, ‘low’, and ‘very low’. Moreover, the 3D model, which was built by attaining the maximum number of dense points, was Agisoft Metashape Pro (15,290,728 points) with very high model quality, and the minimum number of dense points was obtained by Meshroom (81,635 points), providing very low model quality. In addition, Autodesk Recap Pro has a slightly smaller number of dense points (1,306,017 points), as compared to VisualSFM's number of dense points (1,495,584 points). However, the model quality is high compared to the VisualSFM model quality, which is medium. Furthermore, Autodesk Recap Pro also provides the feature to create surface models (meshing) and texturing, but VisualSFM does not provide these options. In contrast, COLMAP generated a very high point cloud density (3,928,305 points) as compared to Autodesk Recap Pro, but the model quality is medium. In addition, COLMAP does not support model texturing. Considering point cloud density and model quality, it does not mean that in any photogrammetry software, model quality will remain high when point cloud density is high, for a certain dataset. However, for trench edges and pipe geometry, controllable workflows (Metashape) and stable meshing/texturing (ReCap) were more predictive of usable models than raw point counts alone. Table 7. Summarises the information gathered from the evaluation of the generated 3D point cloud models.
Table 7. Statistical Data of 3D Point Cloud Models
|
Sr. No. |
Photogrammetry Tool |
Point cloud Density (No. of Points) |
Model Quality |
Mesh Option |
Texture Option |
|
1 |
Agisoft Metashape Pro |
15,290,728 |
Very High |
✔ |
✔ |
|
2 |
VisualSFM |
1,495,584 |
Medium |
❌ |
❌ |
|
3 |
Meshroom |
81,635 |
Very Low |
✔ |
✔ |
|
4 |
Regard 3D |
963,838 |
Low |
✔ |
✔ |
|
5 |
Autodesk Recap Pro |
1,306,017 |
High |
✔ |
✔ |
|
6 |
COLMAP |
3,928,305 |
Medium |
✔ |
❌ |
Percentage Completion and Percentage Noise of The Trench and Pipeline Model (Numerical Analysis)
In this evaluation, the 3D-generated point cloud models were assessed using CloudCompare software. Model completion was determined by scaling the reconstructed point cloud against the GTD in CloudCompare, while noise levels were also calculated within the same software. The numerical results are presented in Table 8, showing the percentage model completion and percentage noise for both trench and pipeline models. The results indicate that most shortlisted photogrammetry tools produced satisfactory outcomes in terms of model completion, except Meshroom. Specifically, Meshroom achieved only 5% model completion for the pipeline, indicating that it was almost unable to generate a usable point cloud for this case. Its trench model completion was also relatively low at 63.77%. In contrast, Agisoft Metashape Pro and Autodesk Recap Pro demonstrated superior performance, both achieving 100% completion for pipeline and trench models. Between these two, Autodesk Recap Pro produced a slightly higher noise level (0.3961%) compared to Agisoft Metashape Pro (0.002%). Regard3D, on the other hand, generated considerably higher noise (2.0198%) compared to all other tools.
Table 8. Numerical analysis of the point cloud models
|
Photogrammetry Tools |
% Model Completion (Pipeline) |
% Model Completion (Trench) |
% Model Noise (Trench and Pipeline) |
|
Agisoft Metashape Pro |
100 |
100 |
0.002 |
|
VisualSFM |
98.5 |
99.28 |
0.3492 |
|
Meshroom |
5 |
63.77 |
0.529 |
|
Regard 3D |
99 |
98.55 |
2.0198 |
|
Autodesk Recap Pro |
100 |
100 |
1.0296 |
|
COLMAP |
97.5 |
95.65 |
0.3961 |
Discussion
A primary contribution of this research is the systematic evaluation of six photogrammetry tools using a trench and pipeline dataset representing a common yet technically challenging construction scenario. Unlike architectural façades or regular building surfaces, trench and pipeline environments contain repetitive soil textures, irregular excavation edges, shadowed regions, partially occluded cylindrical pipes, and depth discontinuities. These characteristics directly influence feature extraction, image matching stability, dense reconstruction quality, and final point cloud usability. Therefore, the differences observed among the tested software are strongly related to how each reconstruction engine handles low-texture surfaces, geometric repetition, and discontinuous boundaries.
The results indicate that Agisoft Metashape Pro achieved the best overall balance of completeness, point density, model quality, and low noise. Its dense cloud generation exceeded 15 million points while maintaining 100% completion for both trench and pipeline components with only 0.002% noise. This suggests that its multi-stage workflow, including controllable alignment parameters, depth-map optimization, and filtering algorithms, is highly effective for infrastructure scenes containing both soil surfaces and metallic cylindrical objects. The extremely low noise value is particularly significant because it reduces the need for post-processing segmentation and cleaning before dimensional analysis or BIM integration. In practical terms, this can shorten decision-making cycles during progress monitoring and earthwork verification. Autodesk Recap Pro also achieved 100% model completion, demonstrating that cloud-based photogrammetry solutions can perform reliably for construction monitoring. Although its point density was lower than Metashape, the resulting model quality remained high. This indicates that raw point count alone is not a sufficient predictor of usable reconstruction quality. Efficient point distribution, surface consistency, edge continuity, and meshing stability may be more important than absolute point quantity. This finding is valuable for practitioners because many field engineers incorrectly assume that denser clouds always mean better outputs. Instead, optimized reconstruction geometry is more critical than excessive data volume. The relatively moderate performance of COLMAP and VisualSFM demonstrates the limitation of research-oriented or academically optimized tools when transferred directly to practical construction environments. Although COLMAP generated a high point count, its final model quality was only medium, indicating that point density without robust filtering and meshing does not necessarily capture trench edges or pipe curvature accurately. Similarly, VisualSFM required multiple runs before successful dense reconstruction, which raises concerns regarding workflow robustness and repeatability under time-sensitive project conditions. For real construction progress monitoring, software reliability is often as important as geometric accuracy because site decisions must be made rapidly with minimal technical intervention. Meshroom showed the weakest performance, particularly with only 5% pipeline completion. This is an important technical observation. Pipelines are cylindrical and often reflective or texture-poor, making them difficult targets for feature-based reconstruction if the software depends heavily on natural image keypoints. The poor recovery of the pipe suggests that some open-source default pipelines may require manual parameter tuning, improved image overlap, artificial targets, or texture enhancement before they become suitable for utility monitoring applications. Therefore, while Meshroom remains valuable for general visualization, it may not currently be dependable for precision construction measurement without further optimization.
From an operational perspective, computational efficiency is highly relevant. Agisoft Metashape completed the full workflow in 19 minutes, whereas COLMAP required 160 minutes. For large-scale pipeline corridors where monitoring may need to be repeated daily or weekly, processing speed directly affects the economic feasibility of digital monitoring systems. If a contractor monitors multiple sections per day, even a 30–60 minute saving per segment can translate into major reductions in labor hours and faster reporting cycles. Thus, processing time should be considered a strategic project management parameter rather than merely a software metric.
Implications of This Research
This study identifies Autodesk Recap Pro and Agisoft Metashape Pro as superior tools based on a comprehensive evaluation, offering construction firms clear guidance for selecting photogrammetry tools in a particular field of application. By providing high-quality results efficiently, these tools empower firms to invest confidently in technologies that align with sustainable construction practices. Photogrammetry offers a reliable alternative to traditional measurement methods, particularly for capturing geometric dimensions of structural elements. These tools produce high-quality models with low computational time, enabling cost-effective and sustainable monitoring solutions. The adoption of photogrammetry can significantly reduce reliance on manual labour and on-site personnel, especially with drone-based data acquisition. This approach minimizes operational costs, enhances safety in hazardous environments, and reduces the environmental footprint of construction monitoring. By aligning with resource efficiency goals, photogrammetry supports the industry's shift towards greener practices. Furthermore, this research establishes a benchmark for evaluating photogrammetry tools, combining visual and numerical analysis to ensure consistency and reliability. Industry professionals can adopt this framework to standardize the assessment and implementation of photogrammetry technologies across diverse projects. Regulatory bodies may integrate these findings into updated standards and guidelines, fostering broader acceptance of photogrammetry in formal construction practices. This integration can enhance transparency, improve project management efficiency, and promote sustainable development. Policymakers are encouraged to endorse photogrammetry as a part of sustainable initiatives, aligning with global trends towards environmentally friendly construction practices. By reducing labour intensity, optimizing resource usage, and lowering environmental impacts, photogrammetry tools contribute to the industry's transformation toward a more sustainable and technologically advanced future.
Conclusion
The study aimed to assess the effectiveness of various photogrammetry tools in progress monitoring within the infrastructure construction sector, with trench and pipeline projects as test cases. The primary objective was to evaluate the outcomes generated by these tools, emphasizing their potential for sustainable and cost-effective data acquisition solutions. Given the extensive range of photogrammetry software available, it is crucial to conduct a thorough examination to identify each tool's strengths and weaknesses, particularly when applied to specific datasets and use cases. To achieve this, six photogrammetry tools were selected and evaluated using a systematic framework. The evaluation criteria included visual assessment metrics such as GUI and features comparison, computational processing time, point cloud density, and model quality, alongside numerical analysis metrics like percentage model completion and percentage noise. The results of this study demonstrate that photogrammetry tools can generate accurate 3D models of trench and pipeline environments, thereby reducing the reliance on manual measurements. This suggests the potential for cost savings and improved safety through remote data acquisition, in line with previous research on digital monitoring methods (Alhamadah et al., 2024; Anwar et al., 2018; Benton et al., 2018; Janiszewski et al., 2023). Among the evaluated tools, Autodesk Recap Pro and Agisoft Metashape Pro consistently outperformed others, achieving 100% model completion for both trench and pipeline datasets Table 8, while maintaining high-quality reconstructions Table 7. Agisoft Metashape Pro, in particular, produced very high point cloud density (over 15 million points) with minimal noise (0.002%), demonstrating its robustness and efficiency in this dataset. These findings are consistent with previous research, such as the study on rebar progress detection, which reported superior performance of Agisoft Metashape in terms of model completion and noise levels (Qureshi, Alaloul, Hussain, et al., 2022). This study underscores the potential of photogrammetry tools to advance sustainable construction practices by optimizing monitoring efficiency, enhancing safety, and reducing environmental impacts.
Future Directions
The application of photogrammetry as a cost-effective solution for data acquisition and progress monitoring in the construction industry is rapidly gaining traction in this era of digitalization. To achieve optimal results, stakeholders must carefully select photogrammetry tools based on available resources and specific use cases. While this study focuses on the trench and pipeline dataset with an emphasis on as-built construction monitoring, the methodology has significant potential for expansion. Future research could incorporate additional evaluation criteria to provide deeper insights into the strengths and weaknesses of various photogrammetry tools, thereby broadening their applicability across different construction scenarios. The continuous development and refinement of digital photogrammetry software present an exciting opportunity for ongoing exploration. Regular updates, new features, and enhanced capabilities are being integrated into these tools, necessitating periodic reassessment of their efficiency and performance. Researchers should perform fresh evaluations of both existing and new datasets to validate the applicability of these updates and ensure the tools’ relevance in diverse contexts. By expanding the scope of evaluation criteria and validating photogrammetry tools in varied construction environments, future studies can establish a more comprehensive understanding of their utility. This will not only enhance their adoption but also drive innovation in sustainable construction practices, ensuring the industry remains adaptive to emerging technological advancements.
Nomenclature
|
%P L p L GTD %T Ni Nc |
Percentage Completion of Pipeline Calculated Length of Pipeline GTD of The Pipeline/Trench Percentage Completion of Trench Length Number of Point Clouds in The Initial Model Number of Point Clouds in The Cleaned Model |
Compliance with ethics guidelines
The authors declare they have no conflict of interest or financial conflicts to disclose.
This article contains no studies with human or animal subjects performed by the authors.
References
Al Khalil, O. (2020). Structure from motion (SfM) photogrammetry as alternative to laser scanning for 3D modelling of historical monuments. Open Science Journal, 5(2), https://doi.org/10.23954/osj.v5i2.2327 .
Alhamadah, A., Mamun, M., Harms, H., Redondo, M., Lin, Y.-Z., Pacheco, J., Salehi, S., & Satam, P. (2024). Photogrammetry for digital twinning industry 4.0 (i4) systems. 2024 IEEE/ACS 21st International Conference on Computer Systems and Applications (AICCSA),
Alidoost, F., & Arefi, H. (2017). Comparison of UAS-based photogrammetry software for 3D point cloud generation: a survey over a historical site. ISPRS Annals of the Photogrammetry, Remote Sensing and Spatial Information Sciences, 4, 55–61.
Alizadehsalehi, S., & Yitmen, I. (2016). The Impact of Field Data Capturing Technologies on Automated Construction Project Progress Monitoring. Procedia Engineering, 161, 97–103. https://doi.org/https://doi.org/10.1016/j.proeng.2016.08.504
Anwar, N., Izhar, M. A., & Najam, F. A. (2018). Construction monitoring and reporting using drones and unmanned aerial vehicles (UAVs). The Tenth International Conference on Construction in the 21st Century (CITC-10),
Balado, J., Garozzo, R., Winiwarter, L., & Tilon, S. (2025). A systematic literature review of low-cost 3D mapping solutions. Information Fusion, 114, 102656.
Becker, R., Galayda, L., & MacLaughlin, M. (2018). Digital photogrammetry software comparison for rock mass characterization. ARMA US Rock Mechanics/Geomechanics Symposium,
Benton, D. J., Warren, S. N., Sunderman, C. B., & Richardson, J. R. (2018). A novel application of photogrammetry to ground convergence monitoring in underground excavations. Novel Optical Systems Design and Optimization XXI,
Bilal, M., Oyedele, L. O., Qadir, J., Munir, K., Ajayi, S. O., Akinade, O. O., Owolabi, H. A., Alaka, H. A., & Pasha, M. (2016). Big Data in the construction industry: A review of present status, opportunities, and future trends. Advanced engineering informatics, 30(3), 500–521.
Bosché, F., Ahmed, M., Turkan, Y., Haas, C. T., & Haas, R. (2015). The value of integrating Scan-to-BIM and Scan-vs-BIM techniques for construction monitoring using laser scanning and BIM: The case of cylindrical MEP components. Automation in Construction, 49, 201–213.
Burns, J., & Delparte, D. (2017). Comparison of commercial structure-from-motion photogrammety software used for underwater three-dimensional modeling of coral reef environments. The International Archives of the Photogrammetry, Remote Sensing and Spatial Information Sciences, 42, 127–131.
Casella, E., Drechsel, J., Winter, C., Benninghoff, M., & Rovere, A. (2020). Accuracy of sand beach topography surveying by drones and photogrammetry. Geo-Marine Letters, 40, 255–268.
Catalucci, S., Marsili, R., Moretti, M., & Rossi, G. (2018). Comparison between point cloud processing techniques. Measurement, 127, 221–226. https://doi.org/https://doi.org/10.1016/j.measurement.2018.05.111
Colomina, I., & Molina, P. (2014). Unmanned aerial systems for photogrammetry and remote sensing: A review. ISPRS Journal of photogrammetry and remote sensing, 92, 79–97.
Delgado-Vera, C., Aguirre-Munizaga, M., Jiménez-Icaza, M., Manobanda-Herrera, N., & Rodríguez-Méndez, A. (2017). A photogrammetry software as a tool for precision agriculture: a case study. International Conference on Technologies and Innovation,
Elhalawani, M. A., Zeidan, Z. M., & Beshr, A. A. (2021). Implementation of close range photogrammetry using modern non-metric digital cameras for architectural documentation. Geodesy and Cartography, 47(1), 45–53.
Fu, K., Peng, J., He, Q., & Zhang, H. (2021). Single image 3D object reconstruction based on deep learning: A review. Multimedia Tools and Applications, 80(1), 463–498.
Gagliolo, S., Ausonio, E., Federici, B., Ferrando, I., Passoni, D., & Sguerso, D. (2018). 3D cultural heritage documentation: A comparison between different photogrammetric software and their products. The International Archives of the Photogrammetry, Remote Sensing and Spatial Information Sciences, 42, 347–354.
Girardeau-Montaut, D. (2016). CloudCompare. France: EDF R&D Telecom ParisTech, 11(5).
Grussenmeyer, P., & Al Khalil, O. (2008). A comparison of photogrammetry software packages for the documentation of buildings.
Huang, R., Xu, Y., Hoegner, L., & Stilla, U. (2022). Semantics-aided 3D change detection on construction sites using UAV-based photogrammetric point clouds. Automation in Construction, 134, 104057.
Janiszewski, M., Prittinen, M., Uotinen, L., Torkan, M., & Rinne, M. (2023). Rapid photogrammetric method for rock mass characterization in underground excavations. ISRM Nordic Rock Mechanics Symposium-NRMS,
Jarahizadeh, S., & Salehi, B. (2024). A comparative analysis of UAV photogrammetric software performance for forest 3D modeling: A case study using AgiSoft photoscan, PIX4DMapper, and DJI Terra. Sensors, 24(1), 286.
Javadnejad, F., Slocum, R. K., Gillins, D. T., Olsen, M. J., & Parrish, C. E. (2021). Dense point cloud quality factor as proxy for accuracy assessment of image-based 3D reconstruction. Journal of Surveying Engineering, 147(1), 04020021.
Jones, C. A., & Church, E. (2020). Photogrammetry is for everyone: Structure-from-motion software user experiences in archaeology. Journal of Archaeological Science: Reports, 30, 102261.
Kim, C., Son, H., & Kim, C. (2011). The effective acquisition and processing of 3D photogrammetric data from digital photogrammetry for construction progress measurement. In Computing in civil engineering (2011) (pp. 178–185).
Kingsland, K. (2019). A comparative analysis of two commercial digital photogrammetry software for cultural heritage applications. New Trends in Image Analysis and Processing–ICIAP 2019: ICIAP International Workshops, BioFor, PatReCH, e-BADLE, DeepRetail, and Industrial Session, Trento, Italy, September 9–10, 2019, Revised Selected Papers 20,
Kingsland, K. (2020). Comparative analysis of digital photogrammetry software for cultural heritage. Digital Applications in Archaeology and Cultural Heritage, 18, e00157.
Knodell, A. R., Wilkinson, T. C., Leppard, T. P., & Orengo, H. A. (2023). Survey archaeology in the Mediterranean world: Regional traditions and contributions to long-term history. Journal of Archaeological Research, 31(2), 263–329.
Kopsida, M., Brilakis, I., & Vela, P. A. (2015). A review of automated construction progress monitoring and inspection methods. Proc. of the 32nd CIB W78 Conference 2015,
Ma, P., Mondal, T. G., Shi, Z., Afsharmovahed, M. H., Romans, K., Li, L., Zhuo, Y., & Chen, G. (2024). Early detection of pipeline natural gas leakage from hyperspectral imaging by vegetation indicators and deep neural networks. Environmental Science & Technology, 58(27), 12018–12027.
Mahami, H., Nasirzadeh, F., Hosseininaveh Ahmadabadian, A., & Nahavandi, S. (2019). Automated progress controlling and monitoring using daily site images and building information modelling. Buildings, 9(3), 70.
Moselhi, O., Bardareh, H., & Zhu, Z. (2020). Automated data acquisition in construction with remote sensing technologies. Applied Sciences, 10(8), 2846.
Musarat, M. A., Alaloul, W. S., Khan, A. M., Ayub, S., & Jousseaume, N. (2024). A survey-based approach of framework development for improving the application of internet of things in the construction industry of Malaysia. Results in Engineering, 21, 101823.
Noordermeer, L., Gobakken, T., Næsset, E., & Bollandsås, O. M. (2021). Economic utility of 3D remote sensing data for estimation of site index in Nordic commercial forest inventories: a comparison of airborne laser scanning, digital aerial photogrammetry and conventional practices. Scandinavian Journal of Forest Research, 36(1), 55–67.
Omar, T., & Nehdi, M. L. (2018). Automated data collection for progress tracking purposes: a review of related techniques. Facing the Challenges in Structural Engineering: Proceedings of the 1st GeoMEast International Congress and Exhibition, Egypt 2017 on Sustainable Civil Infrastructures 1,
Pal, A., Lin, J. J., Hsieh, S.-H., & Golparvar-Fard, M. (2023). Automated vision-based construction progress monitoring in built environment through digital twin. Developments in the Built Environment, 100247.
Palestini, C., Basso, A., & Perticarini, M. (2022). Machine learning as an alternative to 3D photomodeling employed in architectural survey and automatic design modelling. International Archives of the Photogrammetry, Remote Sensing and Spatial Information Sciences, 48(2/W1-2022), 191–197.
Paneru, S., & Jeelani, I. (2021). Computer vision applications in construction: Current state, opportunities & challenges. Automation in Construction, 132, 103940.
Pazhoohesh, M., & Zhang, C. (2015). Automated construction progress monitoring using thermal images and wireless sensor networks. GEN, 101(01).
Pučko, Z., Šuman, N., & Rebolj, D. (2018). Automated continuous construction progress monitoring using multiple workplace real time 3D scans. Advanced engineering informatics, 38, 27–40.
Qureshi, A. H., Alaloul, W. S., Hussain, S. J., Murtiyoso, A., Saad, S., Alzubi, K. M., Ammad, S., & Baarimah, A. O. (2022). Evaluation of photogrammetry tools following progress detection of rebar towards sustainable construction processes. Sustainability, 15(1), 21.
Qureshi, A. H., Alaloul, W. S., Murtiyoso, A., Saad, S., & Manzoor, B. (2022). Comparison of photogrammetry tools considering rebar progress recognition. International Archives of the Photogrammetry, Remote Sensing and Spatial Information Sciences, 43, 141–146.
Radman, K., Jelodar, M. B., Lovreglio, R., Ghazizadeh, E., & Wilkinson, S. (2022). Digital technologies and data-driven delay management process for construction projects. Frontiers in Built Environment, 8, 1029586.
Rahaman, H., & Champion, E. (2019). To 3D or not 3D: choosing a photogrammetry workflow for cultural heritage groups. Heritage, 2(3), 1835–1851.
Rao, A. S., Radanovic, M., Liu, Y., Hu, S., Fang, Y., Khoshelham, K., Palaniswami, M., & Ngo, T. (2022). Real-time monitoring of construction sites: Sensors, methods, and applications. Automation in Construction, 136, 104099.
Rebolj, D., Pučko, Z., Babič, N. Č., Bizjak, M., & Mongus, D. (2017). Point cloud quality requirements for Scan-vs-BIM based automated construction progress monitoring. Automation in Construction, 84, 323–334.
Róg, M., & Rzonca, A. (2021). The impact of photo overlap, the number of control points and the method of camera calibration on the accuracy of 3D model reconstruction. Geomatics and Environmental Engineering, 15(2), 67–87.
Ruzgiene, B. (2007). Comparison between digital photogrammetric systems. Geodezija ir kartografija, 33(3), 75–79.
Saif, W., & Alshibani, A. (2022). Smartphone-based photogrammetry assessment in comparison with a compact camera for construction management applications. Applied Sciences, 12(3), 1053.
Selvaggi, I., Dellapasqua, M., Franci, F., Spangher, A., Visintini, D., & Bitelli, G. (2018). 3D comparison towards a comprehensive analysis of a building in cultural heritage. International Archives of the Photogrammetry, Remote Sensing and Spatial Information Sciences, 42, 1061–1066.
Shao, Z., Yang, N., Xiao, X., Zhang, L., & Peng, Z. (2016). A multi-view dense point cloud generation algorithm based on low-altitude remote sensing images. Remote Sensing, 8(5), 381.
Su, Z. (2021). Advanced 2D and 3D Computer Vision for a Smarter City-From Image to Point Cloud. Hong Kong University of Science and Technology (Hong Kong).
Turkan, Y. (2012). Automated construction progress tracking using 3D sensing technologies.
Vinodkumar, P. K., Karabulut, D., Avots, E., Ozcinar, C., & Anbarjafari, G. (2024). Deep learning for 3d reconstruction, augmentation, and registration: A review paper. Entropy, 26(3), 235.
Vlachos, M., Berger, L., Mathelier, R., Agrafiotis, P., & Skarlatos, D. (2019). Software comparison for underwater archaeological photogrammetric applications. The International Archives of the Photogrammetry, Remote Sensing and Spatial Information Sciences, 42, 1195–1201.
Wright, A. E., Conlin, D. L., & Shope, S. M. (2020). Assessing the accuracy of underwater photogrammetry for archaeology: A comparison of structure from motion photogrammetry and real time kinematic survey at the east key construction wreck. Journal of Marine Science and Engineering, 8(11), 849.
Xu, Y., Ye, Z., Huang, R., Hoegner, L., & Stilla, U. (2020). Robust segmentation and localization of structural planes from photogrammetric point clouds in construction sites. Automation in Construction, 117, 103206.
Yalcinkaya, M., & Singh, V. (2015). Patterns and trends in building information modeling (BIM) research: A latent semantic analysis. Automation in Construction, 59, 68–80.
License
License
Copyright (c) 2026 by Authors

This work is licensed under a Creative Commons Attribution 4.0 International License.


